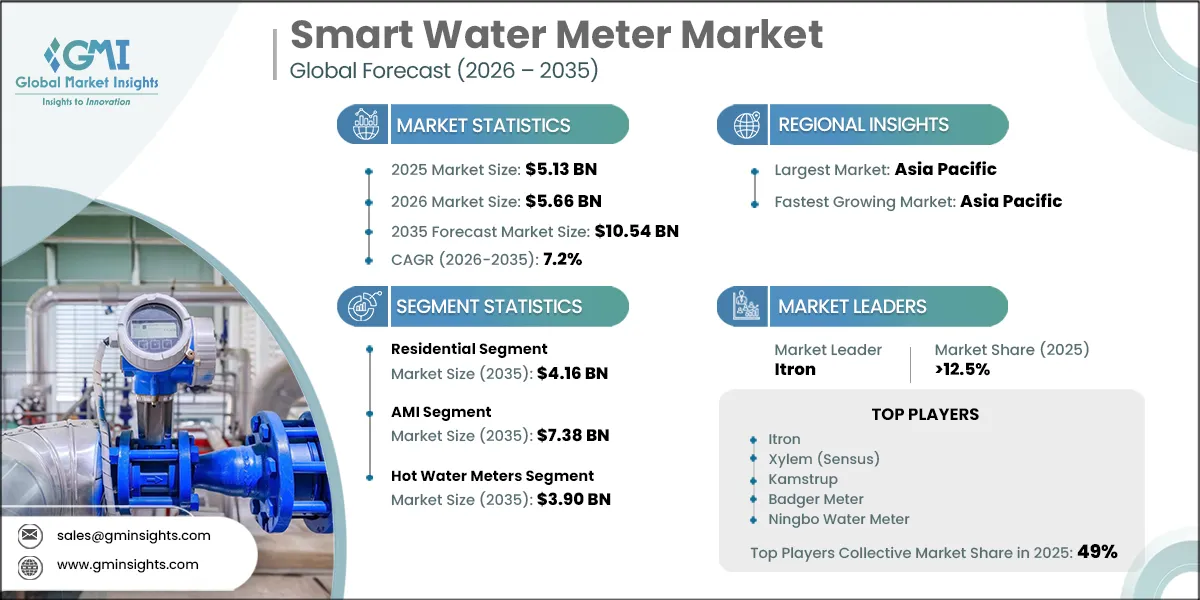
The smart water meter market was valued at USD 5.13 billion in 2025, is expected to reach USD 5.66 billion in 2026, and is projected to expand at a revenue CAGR of 7.2% from 2026 to 2035, reaching USD 10.54 billion by 2035.
The smart water meter market covers connected electronic water-measurement hardware and bundled communication modules used across residential, commercial, and utility applications. Demand is shifting from periodic billing measurement toward operational data capture, allowing utilities and property operators to identify abnormal consumption, improve billing accuracy, and prioritize network interventions. The resulting procurement case is strongest where replacement cycles coincide with water-loss reduction, regulatory reporting, or customer-service modernization.
GMI Analyst View
Based on our primary research and discussions with utility procurement specialists, the global smart water meter market reached approximately 40.1 million units in installed deployments in 2025, representing the most significant single-year addition the market has recorded to date and underscoring the scale of active replacement cycles now underway across major utility networks in North America, Europe, and Asia Pacific.
Smart Water Meter Market Trends, Growth Drivers & GMI Forecast Outlook
Smart metering demand is increasingly tied to utility operating economics rather than meter replacement alone. Water-loss recovery, regulatory reporting, and network visibility are raising the value of connected hardware, while funding availability, pipe-rehabilitation priorities, and compliance requirements determine the pace at which utilities can convert demand into deployments.
Key Drivers
Driver
Evidence signal
Market-demand implication
GMI forecast condition
Non-revenue water recovery
Global non-revenue water losses are valued at USD 39 billion per year [1]
Near-real-time flow monitoring and automated leak detection in AMI-enabled meters allow utilities to identify distribution losses within hours, directly recovering unmetered volume and associated revenue
Accelerated utility-segment AMI adoption in Asia Pacific and MEA, where NRW rates are highest; utility segment revenue CAGR outpaces residential through 2035
Drinking water infrastructure reinvestment
U.S. drinking water utilities require an average annual capital investment of USD 90.2 billion through 2050 to meet infrastructure needs [2]
Large-scale meter replacement programs embedded in multi-decade utility reinvestment cycles create sustained AMI procurement demand relatively insulated from short-term economic conditions
North America and Europe sustain mid-single-digit revenue CAGR anchored by regulatory-mandated replacement programs through the forecast period
EU regulatory compliance mandates
Directive (EU) 2020/2184 establishes consumer access-to-information and monitoring requirements with compliance milestones through 2026 and 2029 [6]
Regulatory obligations compel EU utilities to migrate from legacy AMR to two-way AMI platforms, supporting hardware procurement beyond ordinary replacement cycles
European AMI shipment share expands progressively as deadlines approach; Germany, UK, and France capture disproportionate investment relative to installed base
*Evidence anchors use cited external data; demand implications and forecast conditions represent GMI analysis.*
Water losses create a direct commercial rationale for interval data. Global non-revenue water reaches 346 million m³ per day, reflecting physical leakage, metering inaccuracy, and unbilled consumption across distribution systems [1]. AMI meters give operators a much faster view of flow anomalies than manual or infrequent read cycles, enabling service-connection leaks and consumption irregularities to be isolated before losses accumulate across billing periods. This mechanism is particularly consequential in water-stressed systems, where recovered volume can defer some supply-side investment while improving revenue assurance.
Infrastructure renewal also creates a durable demand floor for connected metering. U.S. water utilities currently spend approximately USD 33.6 billion annually on capital programs, underscoring the scale of the investment gap addressed by long-horizon reinvestment plans [2]. When meter replacement is incorporated into asset-renewal programs, utilities can align hardware procurement with communications architecture, data-management requirements, and customer-service workflows. The resulting tenders tend to favor vendors able to reduce deployment complexity and support long operating cycles.
European compliance requirements add a separate source of demand. Consumer-access and monitoring obligations make remotely available consumption information more valuable to utilities than legacy one-way reading alone. As deadlines approach, procurement is likely to favor interoperable AMI configurations that can support both customer communication and operational network data without creating a separate technology stack.
Key Restraints
Restraint
Evidence signal
Market-demand implication
GMI forecast condition
Constrained utility capital budgets
U.S. drinking water utilities face an estimated annual infrastructure funding gap of USD 56.6 billion [2]
Limited capital forces utilities to ration and phase smart metering programs, prioritizing emergency pipe repair over meter digitization in financially stressed systems
Residential AMI penetration proceeds in phased 5-10-year rollouts; large utilities account for disproportionate near-term AMI volume while smaller systems lag
Aging primary infrastructure competing for capital
Nearly 20% of U.S. installed water distribution mains have exceeded their useful lives and await replacement due to inadequate funding [7]
Utilities facing urgent pipe failure risk allocate available capital to pipe replacement before meter digitization, directly competing for the same constrained capital envelope
Volume growth in North America and portions of Europe remains concentrated in large systems with sound pipe condition; aging-network utilities delay smart meter programs by 3-5 years
Cybersecurity, data privacy, and interoperability compliance
AMI networks are designated critical water infrastructure under the EU NIS2 Directive and U.S. EPA cybersecurity guidance, subject to risk management, residential data handling, and network audit obligations
Compliance requirements extend AMI procurement and commissioning timelines, increase total program cost beyond hardware, and require specialized organizational capabilities
Utilities in GDPR-jurisdiction markets face longer time-to-value cycles; NIS2 implementation extends procurement timelines, tempering near-term adoption velocity
*Evidence anchors use cited external data; demand implications and forecast conditions represent GMI analysis.*
Capital scarcity changes the sequence of utility modernization. In financially stressed systems, urgent treatment, pipe-replacement, and regulatory obligations can take precedence over meter digitization even when AMI has a compelling lifecycle case. This favors phased rollouts, beginning with high-loss districts, large commercial accounts, or customer groups where remote data can quickly improve collections and service outcomes.
Primary-infrastructure condition intensifies that trade-off. A utility confronting failures on buried mains may reasonably defer meter modernization because the same capital envelope must address more immediate reliability risk. Suppliers therefore face uneven addressable demand: large utilities with established asset-management programs can execute broad deployments, while smaller systems may require financing support, modular implementation plans, or managed-service structures before converting interest into orders.
Cybersecurity and data governance are also becoming procurement variables rather than post-installation considerations. High-frequency residential consumption data requires clear controls over data access, network security, vendor responsibilities, and interoperability. Those requirements can improve long-term program resilience, but they lengthen technical evaluation and commissioning, particularly where utilities lack internal digital-security capabilities.
GMI Analyst View
We view funding architecture as the principal divider between early and delayed adoption. Utilities that secure multi-year capital authorization can treat AMI as a system-level operating investment, whereas those facing annual budget uncertainty tend to limit deployments to narrowly defined operational problems. That distinction will shape vendor opportunity more than the availability of meter technology itself.
Smart Water Meter Market Segment Analysis
By Application
Residential
The residential segment generated USD 2.28 billion in 2025 and is projected to reach USD 4.16 billion by 2035. The smart water meter market in residential applications is supported by the need for more accurate billing, customer-facing consumption visibility, and earlier detection of household leaks. Replacement demand is increasingly moving from first-generation remote-read installations toward connected platforms that can support alerts, digital portals, and more frequent data collection. Residential rollouts remain sensitive to utility financing capacity because deployment economics depend on installation logistics and customer-engagement readiness.
Commercial
The commercial segment is projected to generate USD 3.37 billion by 2035 and is expected to expand at a 7.9% CAGR from 2026 to 2035. Commercial users place a higher operational value on timely sub-meter data where water consumption affects tenant allocation, facility-management decisions, or risk of property damage. Hotels, hospitals, offices, and retail facilities are increasingly evaluating smart metering alongside building-management systems, creating a demand profile that favors data accessibility, integration capability, and rapid identification of abnormal use. This broadens procurement beyond conventional utility-led meter replacement.
Utility
The utility segment accounted for 26.0% of market revenue in 2025 and is projected to reach USD 3.00 billion by 2035. Utility-grade deployments address bulk measurement, district monitoring, and large-connection management, where data reliability and flow-range performance are central procurement criteria. These installations can support distribution-zone balancing and leakage analysis, making the value proposition more operationally immediate than at individual residential connections. Demand is especially strong where public authorities link water-loss targets with modernization of municipal networks.
By Technology
AMI
AMI accounted for 58.5% of market revenue in 2025 and is projected to generate USD 7.38 billion by 2035. AMI is gaining preference because two-way communications enable remote diagnostics, interval data, and more responsive customer-service workflows. Utilities adopting AMI are making a broader platform decision that encompasses connectivity, meter-data management, cybersecurity, and integration with operating systems. That raises switching costs and makes interoperability, communications resilience, and vendor implementation capability important competitive differentiators.
AMR
AMR generated USD 2.13 billion in revenue in 2025 and is expected to expand at a 3.8% CAGR from 2026 to 2035. AMR remains relevant where utilities seek to replace manual reading without committing to full two-way communications infrastructure. Its lower technical complexity can suit budget-constrained systems and early-stage modernization programs. However, AMR is increasingly a transitional solution where utilities anticipate future requirements for granular data, remote diagnostics, and automated leak-management capabilities.
By Product
Hot Water Meter
Hot water meters are projected to generate USD 3.90 billion by 2035 and are expected to expand at an 8.2% CAGR from 2026 to 2035. Hot water metering has distinct demand drivers in multi-dwelling buildings, district-heating environments, and commercial facilities where consumption measurement supports heat-cost allocation and energy-management practices. Product selection emphasizes compact installation, long battery life, and reliable performance under elevated temperatures. This creates a channel that often involves building owners and facility managers rather than municipal water utilities.
Cold Water Meter
Cold water meters generated USD 3.41 billion in revenue in 2025 and are projected to account for 63.0% of market revenue by 2035. Cold water meters remain the volume foundation of the market because they serve the broadest set of residential, commercial, and utility connections. Mature markets are upgrading installed AMR and early smart-meter fleets, while developing markets are expanding metering coverage at newly connected or previously manually read sites. Their wide applicability makes cold water products central to vendor scale, manufacturing efficiency, and distribution reach.
GMI Analyst View
We see the product mix separating into two purchasing environments. Building-oriented hot water applications reward compact design, low-maintenance operation, and compatibility with property-management systems, while utility-grade cold water deployments prioritize communications reliability and network-scale analytics. Suppliers that can serve both environments will be less dependent on any single replacement cycle or customer channel.
Smart Water Meter Market Regional Analysis
North America Smart Water Meter Market Analysis
The North America smart water meter market generated USD 1.08 billion in 2025 and is expected to expand at a 6.0% CAGR from 2026 to 2035. The region is supported by a large installed base of utility metering infrastructure and an active transition toward cellular and other connected AMI architectures. Procurement increasingly evaluates the full operating model, including data platforms, network management, customer support, and the ability to integrate new meters with existing utility systems. Capital constraints remain significant for smaller systems, concentrating large programs among better-funded municipal and regional utilities.
U.S.
The U.S. market generated USD 882.9 million in 2025 and is projected to reach USD 1.64 billion by 2035. Large utilities are replacing drive-by and legacy remote-reading systems with connected platforms that improve customer consumption visibility and operational leak detection. EPA recognizes advanced metering infrastructure as a tool that can provide frequent usage information and support water-conservation and utility-efficiency objectives [3]. Project execution is increasingly structured around multi-year deployments rather than isolated equipment purchases.
Canada
Canada accounted for 18.0% of North American revenue in 2025 and is expected to expand at a 6.0% CAGR from 2026 to 2035. Canadian adoption is led by municipalities integrating smart metering into wider capital-planning and conservation programs. Regional variation in utility scale, procurement practices, and infrastructure funding remains material, making local implementation capability and channel relationships important to supplier success.
Europe Smart Water Meter Market Analysis
Europe accounted for 25.5% of global revenue in 2025 and is projected to generate USD 2.42 billion by 2035. European demand is shaped by digitalization programs, established local supplier networks, and regulatory requirements affecting consumption information and water-system monitoring. The Drinking Water Directive creates a policy context that supports more accessible consumer information and strengthens the case for modernized metering infrastructure [6]. Procurement is often linked to regulated utility investment cycles, favoring suppliers with proven interoperability and long-term service capability.
Germany
Germany generated USD 326.9 million in 2025 and is expected to expand at a 5.2% CAGR from 2026 to 2035. Germany combines municipal cold-water metering demand with building-level requirements associated with heat-cost allocation. Its comparatively mature technology base shifts opportunity toward higher-specification replacements, ultrasonic products, and upgrades that improve data availability rather than first-time metering alone.
UK
The UK market is projected to generate USD 484.9 million by 2035 and accounted for 21.0% of European revenue in 2025. Regulated water-company investment programs are supporting structured smart-meter procurement in England and Wales. Utilities are deploying connected meters to strengthen consumption monitoring, leakage management, and customer engagement, creating an addressable market that depends on suppliers' ability to meet framework-contract requirements and integrate with established operational systems.
France
France generated USD 254.9 million in 2025 and is projected to account for 19.0% of European revenue by 2035. French demand is linked to network modernization at municipal and concession-operated utilities. Smart metering is increasingly embedded in broader operational-data initiatives, where the value of hardware depends on how effectively utilities can combine consumption information with leak-management and customer-service processes.
Italy
Italy is projected to generate USD 387.9 million by 2035 and is expected to expand at a 6.5% CAGR from 2026 to 2035. Elevated distribution losses and aging networks strengthen the case for remote metering and more granular consumption data. The market's growth potential depends on whether water-sector modernization programs can translate regulatory and infrastructure funding into sustained utility procurement, particularly in regions where network rehabilitation and metering investment must progress together.
Sweden
Sweden accounted for 5.5% of European revenue in 2025 and is expected to expand at a 5.0% CAGR from 2026 to 2035. Sweden represents a relatively mature market where utilities are upgrading earlier smart-meter installations and communication systems. Demand therefore centers on system capability, network compatibility, and lifecycle reliability, rather than broad first-time deployment.
Asia Pacific Smart Water Meter Market Analysis
The Asia Pacific Smart Water Meter Market generated USD 1.92 billion in 2025 and is expected to expand at an 8.4% CAGR from 2026 to 2035. Asia Pacific combines large urban water networks, public-sector digitalization programs, and cost-competitive domestic manufacturing. Government-supported leakage reduction and smart-city investment are encouraging high-volume procurement, while NB-IoT-capable and ultrasonic configurations are gaining traction across varied utility environments. The scale of regional programs makes manufacturing capacity and local tender access decisive competitive variables.
China
China generated USD 721.0 million in 2025 and is projected to reach USD 1.88 billion by 2035. China's market is supported by large public utility tenders and the integration of network digitalization into urban water-management priorities. Domestic suppliers benefit from manufacturing scale and familiarity with local procurement processes, while technology competition increasingly centers on communications capability, reliability, and cost-effective deployment at volume.
India
India is expected to expand at an 11.6% CAGR from 2026 to 2035 and is projected to generate USD 863.3 million by 2035. India's opportunity is closely tied to urban water-supply expansion, non-revenue-water reduction, and government-backed infrastructure initiatives. Deployment timelines can be extended by municipal procurement processes and implementation capacity, but the need for district monitoring and automated data collection supports a substantial long-term market opportunity.
Japan
Japan generated USD 355.7 million in 2025 and is expected to expand at a 5.0% CAGR from 2026 to 2035. Japan's aging infrastructure and utility labor constraints support the migration from conventional reading processes toward remotely managed metering. The market favors reliable, high-quality products and local commercial partnerships. Kamstrup and Azbil Kimmon announced a collaboration to develop and launch next-generation ultrasonic smart water meters for Japan, combining metering technology with local market access [5].
South Korea
South Korea accounted for 10.5% of Asia Pacific revenue in 2025 and is projected to generate USD 354.2 million by 2035. Strong telecommunications infrastructure and smart-city investment provide a supportive base for AMI adoption. Suppliers that can align meter communications with broader urban digital platforms are positioned to benefit from integrated infrastructure procurement.
Australia
Australia generated USD 115.4 million in 2025 and is expected to expand at a 6.2% CAGR from 2026 to 2035. Water scarcity and demand-management priorities make timely consumption data valuable to state water authorities and urban utilities. Smart-meter programs are used to improve customer awareness during water restrictions while helping operators identify leakage and unusual demand patterns across dispersed service territories.
Middle East & Africa Smart Water Meter Market Analysis
The Middle East & Africa accounted for 10.0% of global revenue in 2025 and is projected to generate USD 1.05 billion by 2035. The region's demand is supported by water scarcity, government-backed utility investment, and the high economic importance of distribution-loss reduction in desalination-dependent markets. Procurement is often concentrated in large state-linked programs, making local partnerships, delivery capacity, and the ability to support complex implementation schedules important for suppliers.
Saudi Arabia
Saudi Arabia generated USD 156.4 million in 2025 and is projected to reach USD 347.9 million by 2035. The country's water-sector modernization agenda supports smart-meter adoption across residential and commercial accounts. Connected metering can improve demand management and distribution oversight in a system where produced water carries a high economic value, strengthening the operational case for reducing losses and improving consumption visibility.
UAE
The UAE accounted for 26.0% of Middle East & Africa revenue in 2025 and is expected to expand at an 8.3% CAGR from 2026 to 2035. High utility-investment capacity and digitally oriented infrastructure programs support adoption of advanced metering. Utility customers and operators both benefit from more immediate consumption data, particularly where smart-city strategies emphasize integrated service delivery and resource efficiency.
South Africa
South Africa generated USD 74.3 million in 2025 and is expected to expand at a 5.8% CAGR from 2026 to 2035. Water losses and service-delivery pressures at large urban utilities provide a clear use case for AMI-based monitoring. Adoption remains shaped by municipal financing, implementation capability, and the need to balance metering investment against broader network-maintenance requirements.
Egypt
Egypt accounted for 12.0% of Middle East & Africa revenue in 2025 and is projected to generate USD 126.5 million by 2035. Urban development and water-utility modernization are expanding the addressable base for connected metering. The market is supported by the need to improve account management and operational visibility across new and expanding urban service areas.
Latin America Smart Water Meter Market Analysis
The Latin America Smart Water Meter Market generated USD 307.6 million in 2025 and is expected to expand at a 7.2% CAGR from 2026 to 2035. Regional demand is led by metropolitan utilities seeking to reduce water losses, improve collections, and modernize customer-service systems. Market development varies substantially by country because utility financing, regulation, and procurement maturity differ across the region. Vendors that can offer practical deployment models and local technical support are better positioned to convert pilot activity into scaled programs.
Brazil
Brazil generated USD 141.5 million in 2025 and is projected to reach USD 306.8 million by 2035. Brazil is the region's principal country opportunity, supported by demand for network efficiency and modernization at large urban utility operators. Smart-meter adoption is linked to efforts to address losses in aging distribution networks and improve the operational economics of water service.
Mexico
Mexico accounted for 30.0% of Latin American revenue in 2025 and is expected to expand at a 7.5% CAGR from 2026 to 2035. Persistent water-loss challenges in major urban systems support the economic case for advanced metering. Adoption depends on utilities' ability to structure procurement and financing around broader infrastructure priorities, creating opportunity for suppliers that can demonstrate near-term operating benefits.
Argentina
Argentina generated USD 36.9 million in 2025 and is expected to expand at a 7.2% CAGR from 2026 to 2035. Smart-meter interest is emerging at major urban utilities seeking better network and consumption visibility. Macroeconomic uncertainty can affect capital-program execution, making flexible procurement structures and phased implementation especially relevant in this market.
GMI Analyst View
We expect regional demand models to diverge rather than converge. Asia Pacific rewards suppliers able to execute high-volume, policy-backed programs with locally appropriate communications technologies, while Middle East markets place greater weight on large, concentrated contracts and complex public-sector delivery requirements. These distinct models will shape product development, channel strategy, and investment priorities across the competitive landscape.
Smart Water Meter Market Share & Competitive Landscape
The smart water meter market share landscape was moderately concentrated in 2025, with the five leading suppliers, including Itron, Xylem (Sensus), Kamstrup, Badger Meter, and Ningbo Water Meter, collectively accounting for approximately 49% of global revenue. Competition increasingly extends beyond meter hardware to include communications architecture, data-management capability, cybersecurity readiness, implementation support, and long-term service economics. Suppliers with integrated AMI platforms are well placed in large utility tenders because they can reduce the number of interfaces a utility must manage across a multi-year deployment.
Itron
Itron held a 12.5% global revenue share in 2025. Its position is supported by end-to-end AMI delivery, including cellular communications, managed network services, and meter-data-management capability. The company manages more than 100 million endpoints globally, providing scale in network operations and connected-device management. Its competitive advantage is strongest where utilities seek a single accountable provider for hardware, connectivity, and operational data workflows.
Xylem (Sensus)
Xylem's Sensus business held a 10.5% global revenue share in 2025. The company competes through water-meter hardware, communications networks, and analytics capabilities, while its wider water-technology portfolio supports participation in broader utility-modernization programs. This cross-portfolio position can be valuable where customers are evaluating metering alongside pumping, treatment, or network-management requirements.
Kamstrup
Kamstrup held a 9.5% global revenue share in 2025. Its ultrasonic metering capability, long calibration life, and integrated service models support its position in European utility programs and building-oriented applications. The company's partnership approach can also improve access to markets where local distribution relationships and regulatory familiarity are essential to successful commercialization.
Badger Meter
Badger Meter competes through connected metering, analytics, and water-quality monitoring capabilities. Its BlueEdge portfolio extends the company's relevance beyond volumetric measurement toward network intelligence and recurring software-enabled services. This positioning is suited to utilities and commercial customers seeking to connect meter data with broader water-management decisions.
Ningbo Water Meter
Ningbo Water Meter is a major Chinese supplier in the competitive set, with a position built on domestic manufacturing scale and cost-competitive AMI and AMR products. Its exposure to China's high-volume utility tenders provides manufacturing economies that can support selective expansion into price-sensitive export markets. Competitive success outside China will depend on channel development, protocol compatibility, and the ability to meet local utility qualification requirements.
Recent Industry Developments
Itron announced a collaboration with Tucson Water in December 2025 to deploy 250,000 smart water communication modules under an AMI program that is scheduled to continue through 2029 [4]. The project combines Itron's cellular modules, managed network services, and Temetra meter-data-management platform to support interval consumption reporting, leak detection, and customer visibility.
Kamstrup and Azbil Kimmon announced their collaboration on next-generation ultrasonic smart water meters for Japan in September 2025, following formalization of the agreement in July 2025 [5]. The partnership combines Kamstrup's metering and cloud leak-detection capabilities with Azbil Kimmon's local distribution relationships and utility-market expertise.
Need a specific section of this report?
Purchase regional analysis, country-level analysis, company profiles, or any other segment-level insights separately
based on your research needs.
Authors: Ankit Gupta, Vishal Saini
Smart Water Meter Market Scope
Smart Water Meter Market Size
Smart Water Meter Market Trends
Smart Water Meter Market Analysis
Smart Water Meter Market Share
Report Content
Chapter 1. Methodology & Scope
1.1 Research approach
1.2 Quality commitment
1.2.1 GMI AI policy & data integrity commitment
1.2.1.1 Source consistency protocol
1.3 Research Trail & Confidence Scoring
1.3.1 Research Trail Components
1.3.2 Scoring Components
1.4 Data Collection
1.4.1 Partial list of primary sources
1.5 Data mining sources
1.5.1 Paid sources
1.5.1.1 Sources, by region
1.6 Base estimates and calculations
1.6.1 Base year calculation for any one approach
1.7 Forecast model
1.8 Research transparency addendum
1.8.1 Source attribution framework
1.8.2 Quality assurance metrics
1.8.3 Our commitment to trust
1.9 Market definitions
Chapter 2. Executive Summary
2.1 Industry 360° Synopsis
2.2 Key market trends
2.2.1 Technology (Chapter 5) trends
2.2.2 Application (Chapter 6) trends
2.2.3 Product (Chapter 7) trends
2.2.4 Regional (Chapter 8) trends
Chapter 3. Industry Insights
3.1 Industry ecosystem analysis
3.1.1 Supplier Landscape
3.1.2 Profit Margin
3.1.3 Cost structure
3.1.4 Value addition at each stage
3.1.5 Factor affecting the value chain
3.1.6 Disruptions
3.2 Industry impact forces
3.2.1 Growth drivers
3.2.1.1 Rising Demand for Water Conservation
3.2.1.2 Government Regulations and Incentives
3.2.1.3 Technological Advancements and Connectivity
3.2.2 Industry pitfalls & challenges
3.2.2.1 High Installation and Maintenance Costs
3.3 Growth potential analysis
3.4 Price trend analysis (USD/Unit)
3.4.1 Historical Price Trend Analysis
3.4.2 Pricing Strategy by Player Type (Premium / Value / Cost-plus)
3.5 Regulatory landscape
3.5.1 North America
3.5.2 Europe
3.5.3 Asia-Pacific
3.5.4 Latin America
3.5.5 Middle East and Africa
3.6 Porter's analysis
3.7 PESTEL analysis
3.8 Cost structure analysis of smart water meters
3.9 Trade data analysis (Driven by Primary Research)
3.9.1 Import/export value trends (Driven by Primary Research)
4.6.1 Tier classification criteria & qualifying thresholds
4.6.2 Tier positioning matrix by revenue, geography & innovation
Chapter 5. Market Size and Forecast, By Technology, 2022 – 2035 (USD Million, ‘000 Units)
5.1 Key trends
5.2 AMI
5.3 AMR
Chapter 6. Market Size and Forecast, By Application, 2022 – 2035 (USD Million, ‘000 Units)
6.1 Key trends
6.2 Residential
6.3 Commercial
6.4 Utility
Chapter 7. Market Size and Forecast, By Product, 2022 – 2035 (USD Million, ‘000 Units)
7.1 Key trends
7.2 Hot water meter
7.3 Cold water meter
Chapter 8. Market Size and Forecast, By Region, 2022 - 2035 (USD Million, ‘000 Units)
8.1 Key trends
8.2 North America
8.2.1 U.S.
8.2.2 Canada
8.3 Europe
8.3.1 Germany
8.3.2 UK
8.3.3 France
8.3.4 Italy
8.3.5 Sweden
8.3.6 Rest of Europe
8.4 Asia Pacific
8.4.1 China
8.4.2 Japan
8.4.3 India
8.4.4 South Korea
8.4.5 Australia
8.4.6 Rest of Asia Pacific
8.5 Middle East & Africa
8.5.1 UAE
8.5.2 Saudi Arabia
8.5.3 South Africa
8.5.4 Egypt
8.5.5 Rest of Middle East & Africa
8.6 Latin America
8.6.1 Brazil
8.6.2 Mexico
8.6.3 Argentina
8.6.4 Rest of Latin America
Chapter 9. Company Profiles
Don't see your key competitors?
The companies listed in this report are a curated selection - not the full competitive universe.
Our market revenue calculations use a bottom-up methodology that accounts for all players across all regions - including manufacturers, distributors, and specialists not individually profiled. The profiles section spotlights strategically significant players; it does not define the scope of our market sizing.
Your competitive landscape may also include
Regional or domestic-only leaders not in the global top tier
Distributors and channel partners who control market access
Emerging disruptors, startups, or adjacent-industry entrants
Niche players focused on a specific application or end-use
Free customization - up to 20% of report value
Need specific data? Request customization and get the insights tailored to your exact requirements.
For inquiries regarding discounts, bulk purchases, or customization requests, please contact us at[email protected]
Over 70% of our clients customize reports to fit their needs. Please tell us how you would like to customize yours below
Share Content
Add Citations
Ankit Gupta. 2026, September. Smart Water Meter Market Size - By Application, By Technology, By Product, Analysis, Growth & Forecast, 2026 - 2035 (Report ID: GMI697). Global Market Insights Inc. Retrieved October 26, 2026, from https://www.gminsights.com/toc/details/smart-water-metering-market
Smart Water Meter Market
Get a free sample of this report
Get a free sample of this report Smart Water Meter Market
Is your requirement urgent? Please give us your business email for a speedy delivery!



Smart Water Meter Market Size
The smart water meter market was valued at USD 5.13 billion in 2025, is expected to reach USD 5.66 billion in 2026, and is projected to expand at a revenue CAGR of 7.2% from 2026 to 2035, reaching USD 10.54 billion by 2035.
The smart water meter market covers connected electronic water-measurement hardware and bundled communication modules used across residential, commercial, and utility applications. Demand is shifting from periodic billing measurement toward operational data capture, allowing utilities and property operators to identify abnormal consumption, improve billing accuracy, and prioritize network interventions. The resulting procurement case is strongest where replacement cycles coincide with water-loss reduction, regulatory reporting, or customer-service modernization.
GMI Analyst View
Based on our primary research and discussions with utility procurement specialists, the global smart water meter market reached approximately 40.1 million units in installed deployments in 2025, representing the most significant single-year addition the market has recorded to date and underscoring the scale of active replacement cycles now underway across major utility networks in North America, Europe, and Asia Pacific.
Smart Water Meter Market Trends, Growth Drivers & GMI Forecast Outlook
Smart metering demand is increasingly tied to utility operating economics rather than meter replacement alone. Water-loss recovery, regulatory reporting, and network visibility are raising the value of connected hardware, while funding availability, pipe-rehabilitation priorities, and compliance requirements determine the pace at which utilities can convert demand into deployments.
Key Drivers
*Evidence anchors use cited external data; demand implications and forecast conditions represent GMI analysis.*
Water losses create a direct commercial rationale for interval data. Global non-revenue water reaches 346 million m³ per day, reflecting physical leakage, metering inaccuracy, and unbilled consumption across distribution systems [1]. AMI meters give operators a much faster view of flow anomalies than manual or infrequent read cycles, enabling service-connection leaks and consumption irregularities to be isolated before losses accumulate across billing periods. This mechanism is particularly consequential in water-stressed systems, where recovered volume can defer some supply-side investment while improving revenue assurance.
Infrastructure renewal also creates a durable demand floor for connected metering. U.S. water utilities currently spend approximately USD 33.6 billion annually on capital programs, underscoring the scale of the investment gap addressed by long-horizon reinvestment plans [2]. When meter replacement is incorporated into asset-renewal programs, utilities can align hardware procurement with communications architecture, data-management requirements, and customer-service workflows. The resulting tenders tend to favor vendors able to reduce deployment complexity and support long operating cycles.
European compliance requirements add a separate source of demand. Consumer-access and monitoring obligations make remotely available consumption information more valuable to utilities than legacy one-way reading alone. As deadlines approach, procurement is likely to favor interoperable AMI configurations that can support both customer communication and operational network data without creating a separate technology stack.
Key Restraints
*Evidence anchors use cited external data; demand implications and forecast conditions represent GMI analysis.*
Capital scarcity changes the sequence of utility modernization. In financially stressed systems, urgent treatment, pipe-replacement, and regulatory obligations can take precedence over meter digitization even when AMI has a compelling lifecycle case. This favors phased rollouts, beginning with high-loss districts, large commercial accounts, or customer groups where remote data can quickly improve collections and service outcomes.
Primary-infrastructure condition intensifies that trade-off. A utility confronting failures on buried mains may reasonably defer meter modernization because the same capital envelope must address more immediate reliability risk. Suppliers therefore face uneven addressable demand: large utilities with established asset-management programs can execute broad deployments, while smaller systems may require financing support, modular implementation plans, or managed-service structures before converting interest into orders.
Cybersecurity and data governance are also becoming procurement variables rather than post-installation considerations. High-frequency residential consumption data requires clear controls over data access, network security, vendor responsibilities, and interoperability. Those requirements can improve long-term program resilience, but they lengthen technical evaluation and commissioning, particularly where utilities lack internal digital-security capabilities.
GMI Analyst View
We view funding architecture as the principal divider between early and delayed adoption. Utilities that secure multi-year capital authorization can treat AMI as a system-level operating investment, whereas those facing annual budget uncertainty tend to limit deployments to narrowly defined operational problems. That distinction will shape vendor opportunity more than the availability of meter technology itself.
Smart Water Meter Market Segment Analysis
By Application
Residential
The residential segment generated USD 2.28 billion in 2025 and is projected to reach USD 4.16 billion by 2035. The smart water meter market in residential applications is supported by the need for more accurate billing, customer-facing consumption visibility, and earlier detection of household leaks. Replacement demand is increasingly moving from first-generation remote-read installations toward connected platforms that can support alerts, digital portals, and more frequent data collection. Residential rollouts remain sensitive to utility financing capacity because deployment economics depend on installation logistics and customer-engagement readiness.
Commercial
The commercial segment is projected to generate USD 3.37 billion by 2035 and is expected to expand at a 7.9% CAGR from 2026 to 2035. Commercial users place a higher operational value on timely sub-meter data where water consumption affects tenant allocation, facility-management decisions, or risk of property damage. Hotels, hospitals, offices, and retail facilities are increasingly evaluating smart metering alongside building-management systems, creating a demand profile that favors data accessibility, integration capability, and rapid identification of abnormal use. This broadens procurement beyond conventional utility-led meter replacement.
Utility
The utility segment accounted for 26.0% of market revenue in 2025 and is projected to reach USD 3.00 billion by 2035. Utility-grade deployments address bulk measurement, district monitoring, and large-connection management, where data reliability and flow-range performance are central procurement criteria. These installations can support distribution-zone balancing and leakage analysis, making the value proposition more operationally immediate than at individual residential connections. Demand is especially strong where public authorities link water-loss targets with modernization of municipal networks.
By Technology
AMI
AMI accounted for 58.5% of market revenue in 2025 and is projected to generate USD 7.38 billion by 2035. AMI is gaining preference because two-way communications enable remote diagnostics, interval data, and more responsive customer-service workflows. Utilities adopting AMI are making a broader platform decision that encompasses connectivity, meter-data management, cybersecurity, and integration with operating systems. That raises switching costs and makes interoperability, communications resilience, and vendor implementation capability important competitive differentiators.
AMR
AMR generated USD 2.13 billion in revenue in 2025 and is expected to expand at a 3.8% CAGR from 2026 to 2035. AMR remains relevant where utilities seek to replace manual reading without committing to full two-way communications infrastructure. Its lower technical complexity can suit budget-constrained systems and early-stage modernization programs. However, AMR is increasingly a transitional solution where utilities anticipate future requirements for granular data, remote diagnostics, and automated leak-management capabilities.
By Product
Hot Water Meter
Hot water meters are projected to generate USD 3.90 billion by 2035 and are expected to expand at an 8.2% CAGR from 2026 to 2035. Hot water metering has distinct demand drivers in multi-dwelling buildings, district-heating environments, and commercial facilities where consumption measurement supports heat-cost allocation and energy-management practices. Product selection emphasizes compact installation, long battery life, and reliable performance under elevated temperatures. This creates a channel that often involves building owners and facility managers rather than municipal water utilities.
Cold Water Meter
Cold water meters generated USD 3.41 billion in revenue in 2025 and are projected to account for 63.0% of market revenue by 2035. Cold water meters remain the volume foundation of the market because they serve the broadest set of residential, commercial, and utility connections. Mature markets are upgrading installed AMR and early smart-meter fleets, while developing markets are expanding metering coverage at newly connected or previously manually read sites. Their wide applicability makes cold water products central to vendor scale, manufacturing efficiency, and distribution reach.
GMI Analyst View
We see the product mix separating into two purchasing environments. Building-oriented hot water applications reward compact design, low-maintenance operation, and compatibility with property-management systems, while utility-grade cold water deployments prioritize communications reliability and network-scale analytics. Suppliers that can serve both environments will be less dependent on any single replacement cycle or customer channel.
Smart Water Meter Market Regional Analysis
North America Smart Water Meter Market Analysis
The North America smart water meter market generated USD 1.08 billion in 2025 and is expected to expand at a 6.0% CAGR from 2026 to 2035. The region is supported by a large installed base of utility metering infrastructure and an active transition toward cellular and other connected AMI architectures. Procurement increasingly evaluates the full operating model, including data platforms, network management, customer support, and the ability to integrate new meters with existing utility systems. Capital constraints remain significant for smaller systems, concentrating large programs among better-funded municipal and regional utilities.
U.S.
The U.S. market generated USD 882.9 million in 2025 and is projected to reach USD 1.64 billion by 2035. Large utilities are replacing drive-by and legacy remote-reading systems with connected platforms that improve customer consumption visibility and operational leak detection. EPA recognizes advanced metering infrastructure as a tool that can provide frequent usage information and support water-conservation and utility-efficiency objectives [3]. Project execution is increasingly structured around multi-year deployments rather than isolated equipment purchases.
Canada
Canada accounted for 18.0% of North American revenue in 2025 and is expected to expand at a 6.0% CAGR from 2026 to 2035. Canadian adoption is led by municipalities integrating smart metering into wider capital-planning and conservation programs. Regional variation in utility scale, procurement practices, and infrastructure funding remains material, making local implementation capability and channel relationships important to supplier success.
Europe Smart Water Meter Market Analysis
Europe accounted for 25.5% of global revenue in 2025 and is projected to generate USD 2.42 billion by 2035. European demand is shaped by digitalization programs, established local supplier networks, and regulatory requirements affecting consumption information and water-system monitoring. The Drinking Water Directive creates a policy context that supports more accessible consumer information and strengthens the case for modernized metering infrastructure [6]. Procurement is often linked to regulated utility investment cycles, favoring suppliers with proven interoperability and long-term service capability.
Germany
Germany generated USD 326.9 million in 2025 and is expected to expand at a 5.2% CAGR from 2026 to 2035. Germany combines municipal cold-water metering demand with building-level requirements associated with heat-cost allocation. Its comparatively mature technology base shifts opportunity toward higher-specification replacements, ultrasonic products, and upgrades that improve data availability rather than first-time metering alone.
UK
The UK market is projected to generate USD 484.9 million by 2035 and accounted for 21.0% of European revenue in 2025. Regulated water-company investment programs are supporting structured smart-meter procurement in England and Wales. Utilities are deploying connected meters to strengthen consumption monitoring, leakage management, and customer engagement, creating an addressable market that depends on suppliers' ability to meet framework-contract requirements and integrate with established operational systems.
France
France generated USD 254.9 million in 2025 and is projected to account for 19.0% of European revenue by 2035. French demand is linked to network modernization at municipal and concession-operated utilities. Smart metering is increasingly embedded in broader operational-data initiatives, where the value of hardware depends on how effectively utilities can combine consumption information with leak-management and customer-service processes.
Italy
Italy is projected to generate USD 387.9 million by 2035 and is expected to expand at a 6.5% CAGR from 2026 to 2035. Elevated distribution losses and aging networks strengthen the case for remote metering and more granular consumption data. The market's growth potential depends on whether water-sector modernization programs can translate regulatory and infrastructure funding into sustained utility procurement, particularly in regions where network rehabilitation and metering investment must progress together.
Sweden
Sweden accounted for 5.5% of European revenue in 2025 and is expected to expand at a 5.0% CAGR from 2026 to 2035. Sweden represents a relatively mature market where utilities are upgrading earlier smart-meter installations and communication systems. Demand therefore centers on system capability, network compatibility, and lifecycle reliability, rather than broad first-time deployment.
Asia Pacific Smart Water Meter Market Analysis
The Asia Pacific Smart Water Meter Market generated USD 1.92 billion in 2025 and is expected to expand at an 8.4% CAGR from 2026 to 2035. Asia Pacific combines large urban water networks, public-sector digitalization programs, and cost-competitive domestic manufacturing. Government-supported leakage reduction and smart-city investment are encouraging high-volume procurement, while NB-IoT-capable and ultrasonic configurations are gaining traction across varied utility environments. The scale of regional programs makes manufacturing capacity and local tender access decisive competitive variables.
China
China generated USD 721.0 million in 2025 and is projected to reach USD 1.88 billion by 2035. China's market is supported by large public utility tenders and the integration of network digitalization into urban water-management priorities. Domestic suppliers benefit from manufacturing scale and familiarity with local procurement processes, while technology competition increasingly centers on communications capability, reliability, and cost-effective deployment at volume.
India
India is expected to expand at an 11.6% CAGR from 2026 to 2035 and is projected to generate USD 863.3 million by 2035. India's opportunity is closely tied to urban water-supply expansion, non-revenue-water reduction, and government-backed infrastructure initiatives. Deployment timelines can be extended by municipal procurement processes and implementation capacity, but the need for district monitoring and automated data collection supports a substantial long-term market opportunity.
Japan
Japan generated USD 355.7 million in 2025 and is expected to expand at a 5.0% CAGR from 2026 to 2035. Japan's aging infrastructure and utility labor constraints support the migration from conventional reading processes toward remotely managed metering. The market favors reliable, high-quality products and local commercial partnerships. Kamstrup and Azbil Kimmon announced a collaboration to develop and launch next-generation ultrasonic smart water meters for Japan, combining metering technology with local market access [5].
South Korea
South Korea accounted for 10.5% of Asia Pacific revenue in 2025 and is projected to generate USD 354.2 million by 2035. Strong telecommunications infrastructure and smart-city investment provide a supportive base for AMI adoption. Suppliers that can align meter communications with broader urban digital platforms are positioned to benefit from integrated infrastructure procurement.
Australia
Australia generated USD 115.4 million in 2025 and is expected to expand at a 6.2% CAGR from 2026 to 2035. Water scarcity and demand-management priorities make timely consumption data valuable to state water authorities and urban utilities. Smart-meter programs are used to improve customer awareness during water restrictions while helping operators identify leakage and unusual demand patterns across dispersed service territories.
Middle East & Africa Smart Water Meter Market Analysis
The Middle East & Africa accounted for 10.0% of global revenue in 2025 and is projected to generate USD 1.05 billion by 2035. The region's demand is supported by water scarcity, government-backed utility investment, and the high economic importance of distribution-loss reduction in desalination-dependent markets. Procurement is often concentrated in large state-linked programs, making local partnerships, delivery capacity, and the ability to support complex implementation schedules important for suppliers.
Saudi Arabia
Saudi Arabia generated USD 156.4 million in 2025 and is projected to reach USD 347.9 million by 2035. The country's water-sector modernization agenda supports smart-meter adoption across residential and commercial accounts. Connected metering can improve demand management and distribution oversight in a system where produced water carries a high economic value, strengthening the operational case for reducing losses and improving consumption visibility.
UAE
The UAE accounted for 26.0% of Middle East & Africa revenue in 2025 and is expected to expand at an 8.3% CAGR from 2026 to 2035. High utility-investment capacity and digitally oriented infrastructure programs support adoption of advanced metering. Utility customers and operators both benefit from more immediate consumption data, particularly where smart-city strategies emphasize integrated service delivery and resource efficiency.
South Africa
South Africa generated USD 74.3 million in 2025 and is expected to expand at a 5.8% CAGR from 2026 to 2035. Water losses and service-delivery pressures at large urban utilities provide a clear use case for AMI-based monitoring. Adoption remains shaped by municipal financing, implementation capability, and the need to balance metering investment against broader network-maintenance requirements.
Egypt
Egypt accounted for 12.0% of Middle East & Africa revenue in 2025 and is projected to generate USD 126.5 million by 2035. Urban development and water-utility modernization are expanding the addressable base for connected metering. The market is supported by the need to improve account management and operational visibility across new and expanding urban service areas.
Latin America Smart Water Meter Market Analysis
The Latin America Smart Water Meter Market generated USD 307.6 million in 2025 and is expected to expand at a 7.2% CAGR from 2026 to 2035. Regional demand is led by metropolitan utilities seeking to reduce water losses, improve collections, and modernize customer-service systems. Market development varies substantially by country because utility financing, regulation, and procurement maturity differ across the region. Vendors that can offer practical deployment models and local technical support are better positioned to convert pilot activity into scaled programs.
Brazil
Brazil generated USD 141.5 million in 2025 and is projected to reach USD 306.8 million by 2035. Brazil is the region's principal country opportunity, supported by demand for network efficiency and modernization at large urban utility operators. Smart-meter adoption is linked to efforts to address losses in aging distribution networks and improve the operational economics of water service.
Mexico
Mexico accounted for 30.0% of Latin American revenue in 2025 and is expected to expand at a 7.5% CAGR from 2026 to 2035. Persistent water-loss challenges in major urban systems support the economic case for advanced metering. Adoption depends on utilities' ability to structure procurement and financing around broader infrastructure priorities, creating opportunity for suppliers that can demonstrate near-term operating benefits.
Argentina
Argentina generated USD 36.9 million in 2025 and is expected to expand at a 7.2% CAGR from 2026 to 2035. Smart-meter interest is emerging at major urban utilities seeking better network and consumption visibility. Macroeconomic uncertainty can affect capital-program execution, making flexible procurement structures and phased implementation especially relevant in this market.
GMI Analyst View
We expect regional demand models to diverge rather than converge. Asia Pacific rewards suppliers able to execute high-volume, policy-backed programs with locally appropriate communications technologies, while Middle East markets place greater weight on large, concentrated contracts and complex public-sector delivery requirements. These distinct models will shape product development, channel strategy, and investment priorities across the competitive landscape.
Smart Water Meter Market Share & Competitive Landscape
The smart water meter market share landscape was moderately concentrated in 2025, with the five leading suppliers, including Itron, Xylem (Sensus), Kamstrup, Badger Meter, and Ningbo Water Meter, collectively accounting for approximately 49% of global revenue. Competition increasingly extends beyond meter hardware to include communications architecture, data-management capability, cybersecurity readiness, implementation support, and long-term service economics. Suppliers with integrated AMI platforms are well placed in large utility tenders because they can reduce the number of interfaces a utility must manage across a multi-year deployment.
Itron
Itron held a 12.5% global revenue share in 2025. Its position is supported by end-to-end AMI delivery, including cellular communications, managed network services, and meter-data-management capability. The company manages more than 100 million endpoints globally, providing scale in network operations and connected-device management. Its competitive advantage is strongest where utilities seek a single accountable provider for hardware, connectivity, and operational data workflows.
Xylem (Sensus)
Xylem's Sensus business held a 10.5% global revenue share in 2025. The company competes through water-meter hardware, communications networks, and analytics capabilities, while its wider water-technology portfolio supports participation in broader utility-modernization programs. This cross-portfolio position can be valuable where customers are evaluating metering alongside pumping, treatment, or network-management requirements.
Kamstrup
Kamstrup held a 9.5% global revenue share in 2025. Its ultrasonic metering capability, long calibration life, and integrated service models support its position in European utility programs and building-oriented applications. The company's partnership approach can also improve access to markets where local distribution relationships and regulatory familiarity are essential to successful commercialization.
Badger Meter
Badger Meter competes through connected metering, analytics, and water-quality monitoring capabilities. Its BlueEdge portfolio extends the company's relevance beyond volumetric measurement toward network intelligence and recurring software-enabled services. This positioning is suited to utilities and commercial customers seeking to connect meter data with broader water-management decisions.
Ningbo Water Meter
Ningbo Water Meter is a major Chinese supplier in the competitive set, with a position built on domestic manufacturing scale and cost-competitive AMI and AMR products. Its exposure to China's high-volume utility tenders provides manufacturing economies that can support selective expansion into price-sensitive export markets. Competitive success outside China will depend on channel development, protocol compatibility, and the ability to meet local utility qualification requirements.
Recent Industry Developments
Itron announced a collaboration with Tucson Water in December 2025 to deploy 250,000 smart water communication modules under an AMI program that is scheduled to continue through 2029 [4]. The project combines Itron's cellular modules, managed network services, and Temetra meter-data-management platform to support interval consumption reporting, leak detection, and customer visibility.
Kamstrup and Azbil Kimmon announced their collaboration on next-generation ultrasonic smart water meters for Japan in September 2025, following formalization of the agreement in July 2025 [5]. The partnership combines Kamstrup's metering and cloud leak-detection capabilities with Azbil Kimmon's local distribution relationships and utility-market expertise.
Need a specific section of this report?
Purchase regional analysis, country-level analysis, company profiles, or any other segment-level insights separately
based on your research needs.