U.S. E-Bike Market Size & Share 2026-2035
Market Size By - Class (Class 1, Class 2, Class 3); By Battery (Lithium-ion, Lead Acid, Others); By Motor (Hub Motor, Mid Motor); By Propulsion (Pedal Assist, Throttle Control); By Ownership (Shared, Personal); By Power Output (Below 250W, 250W to 750W, Above 750W); By Sales Channel (Online, Offline); By Application (City/Urban, Trekking, Cargo, Mountain/Off-Road, Others) - Growth Forecast. The market forecasts are provided in terms of value (USD) & shipment (Units).
Report ID: GMI14467
|
Published Date: March 2026
|
Report Format: PDF
Download Free PDF
Authors:
Preeti Wadhwani, Satyam Thakare


U.S. E-Bike Market Size
The U.S. e-bike market was estimated at USD 2 billion in 2025. The market is expected to grow from USD 2.2 billion in 2026 to USD 4.3 billion in 2035, at a CAGR of 7.8% according to latest report published by Global Market Insights Inc.
U.S. E-Bike Market Key Takeaways
Market Size & Growth
Regional Dominance
Key Market Drivers
Challenges
Opportunity
Key Players
The e-bike market is growing in the United States because of government programs that promote sustainable transportation. The federal, state, and city initiatives that allow zero-emission mobility are purchase incentives, tax rebates, and cycling infrastructure investments. Large bike lanes, greenways, and guarded movement avenues promote people to commute on a daily basis on a bicycle, enhance the safety of riders, and boost the confidence of consumers in embracing the use of e-bikes significantly.
In 2025, about 1.5 million e-bikes sold nationwide in the US, which indicates the ongoing fast consumerization of electric micro-mobility solutions. High purchase volumes also imply increased demand in cost-effective and efficient commuting options due to the increase in fuel prices and the congestion in the urban areas. This is positive growth that is motivating manufacturers to grow their product lines, improve their distribution channels, and invest more in newer e-bike technologies.
Megacities in the US are rapidly investing in bicycles and e-bikes to enable mobility on a sustainable level in the city. New York City alone intends to create more than 500 miles of sheltered bike paths by 2030, 78 miles of which have already been installed since 2022, and cities like Chicago, Denver, Minneapolis, Seattle and Portland are building special lanes, bike paths that are open all year and bicycle charging stations. These efforts are boosting commuter confidence and hastening the pace of e-bikes use in the urban transportation systems.
The value of e-bikes is being enhanced by technological improvements in battery efficiency, motor performance and lightweight materials. The extended range of ride, quicker charging, inbuilt smart displays, and linked mobile applications contribute to the user experience and reliability. These innovations appeal to the recreational riders and the commuters, increasing the consumer pool and speeding up the uptake of these innovations by the various types of consumers.
The state of Texas has been experiencing a surge in the use of e-bikes because of the growing urbanization and the high commuting distance as well as growing interest in alternative mobility options. The emerging popular cities like Austin and Dallas are also investing in cycling infrastructure and sustainability efforts at the same time that younger people and tech-savvy commuters are seeking more convenient methods of transportation that will save them on fuel costs and increase their flexibility in their day-to-day travel.
California has the highest concentration of the e-bike market in the United States because of the high levels of environmental policies, cycling infrastructure, and awareness of sustainable mobility. At the state level, incentives programs and city climate initiatives promote the use of electric bikes, and the high population density in such metropolitan areas like Los Angeles and San Francisco makes the use of the low-carbon commuting methods highly demanded.
U.S. E-Bike Market Trends
The growing traffic jams and major urban centers, like New York, Los Angeles, and Chicago is motivating commuters to use e-bikes as a more convenient and quicker way to travel. Using e-bikes, the rider is able to avoid traffic congestion and parking issues in addition to being affordable. With the ever-growing population of urban people, e-bikes are now becoming a viable alternative to commuting and travelling over short distances.
The U.S. e-bike is greatly expanding due to the government policies, which favor sustainable mobility and the use of low-emission vehicles. The incentive programs, the tax credits, and the rebates offered at the federal and state levels also promote the transition of the consumers to the electric bicycles. Cycling lanes, urban mobility corridors, and green transportation plans are enhancing accessibility and safety, which further boosts consumer confidence in the adoption of e-bikes.
The promotion of the benefits of health and fitness is an encouraging fact that makes the consumers consider the use of cycling in their everyday lives. With the assistance of pedals offered by e-bikes, bikers of various age categories and physical capabilities will be able to enjoy riding without placing too much effort into the process. This ease of use is widening the customer base especially among the older people and recreation riders who need convenient modes of exercising.
The growth of last-mile operations and urban logistics systems is fueling the need to use cargo and commercial e-bikes. Retailers and courier companies as well as food delivery services are starting to use e-bikes in order to cut fuel costs and enhance delivery efficiency in congested urban areas. Electric cargo bikes make deliveries faster, emit less, and have lower operations costs to the businesses.
Innovations in battery levels, lightweight frames, and motor systems integrated into the e-bikes are improving the efficiency and reliability of the contemporary e-bikes. Better battery life, quicker charging technology and intelligent connectivity like GPS positioning and mobile apps are winning the favor of tech-savvy customers and commuters who need high-tech mobility options.
The rising popularity of outdoor recreation and adventure tourism also leads to the U.S. e-bike market development. Electric bikes, which include the electric mountain bikes and touring e-bikes, enable the riders to have a longer and more difficult trail to follow without much exertion. This trend is encouraging both experienced cyclists and beginners to participate in cycling activities.
U.S. E-Bike Market Analysis
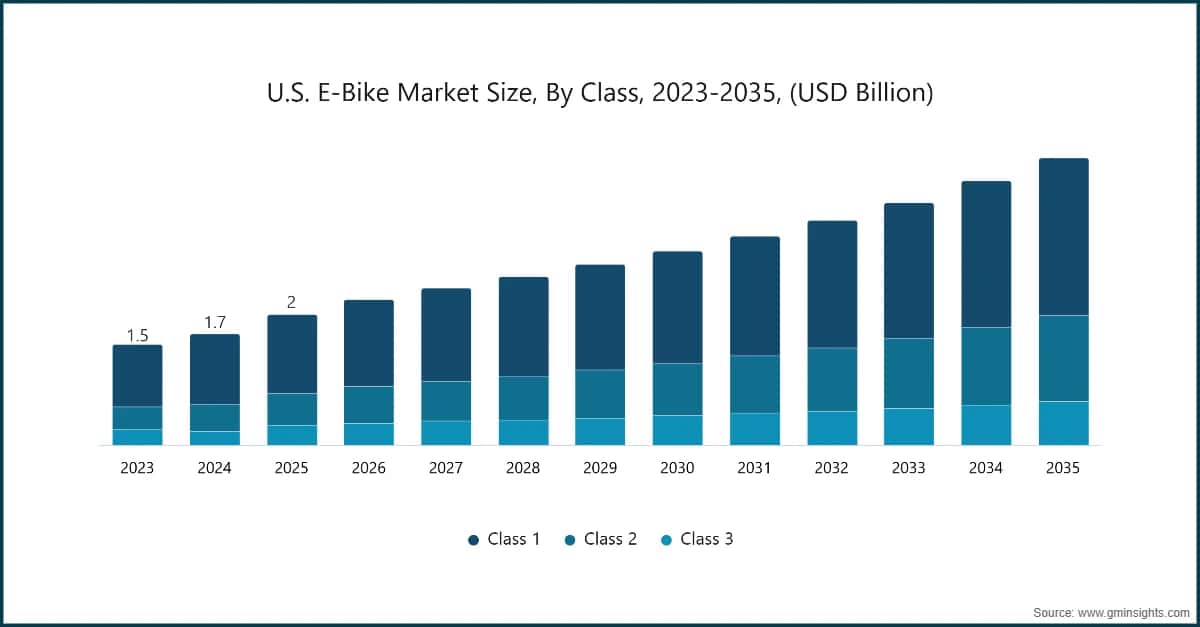
Based on class, the U.S. e-bikes market is divided into class 1, class 2, and class 3. The class 1 segment dominated the market, accounting for around 61% in 2025 and is expected to grow at a CAGR of over 6% from 2026 to 2035.
Based on battery, the U.S. e-bikes market is segmented into lithium-ion, lead acid, and others. The lithium-ion dominate the market with 78% share in 2025, and the segment is expected to grow at a CAGR of over 7% from 2026 to 2035.
Based on propulsion, the e-bike market is segmented pedal assist, and throttle control. The pedal assist segment dominated the market, accounting for share of 75% in 2025.
Based on motor, the market is divided into hub motor and mid motor. Hub motor dominates with 66% market share in 2025.
California dominated the U.S. e-bike market in West U.S. with around 17% share and generated USD 128.2 million in revenue in 2025.
New York e-bike market reached over USD 35 million in 2025. New York’s dense urban environment and limited parking availability are encouraging residents to adopt e-bikes for everyday commuting.
Minnesota e-bike market in Midwest U.S. is projected to grow at a strong CAGR of 8% from 2026 to 2035. Minnesota’s strong cycling culture and long-standing popularity of recreational biking are supporting the rapid adoption of e-bikes across the state.
Florida e-bike market in Southwest U.S. reached significant scale in 2025. Florida’s favorable climate and year-round riding conditions significantly support the growth of the market. Unlike colder northern states, Florida allows consistent cycling throughout the year, encouraging both commuting and recreational use.
U.S. E-Bike Market Share
U.S. E-Bike Market Companies
Major players operating in the U.S. e-bike industry include:
9% market share
Collective Market Share in 2025 is 33%
U.S. E-Bike Industry News
The U.S. e-bike market research report includes in-depth coverage of the industry with estimates & forecasts in terms of revenue ($ Mn/Bn) and shipment (Units) from 2022 to 2035, for the following segments:
Click here to Buy Section of this Report
Market, By Class
Market, By Battery
Market, By Motor
Market, By Propulsion
Market, By Ownership
Market, By Power output
Market, By Sales channel
Market, By Application
The above information is provided for the following regions and countries:
Research methodology, data sources & validation process
This report draws on a structured research process built around direct industry conversations, proprietary modelling, and rigorous cross-validation and not just desk research.
Our 6-step research process
1. Research design & analyst oversight
At GMI, our research methodology is built on a foundation of human expertise, rigorous validation, and complete transparency. Every insight, trend analysis, and forecast in our reports is developed by experienced analysts who understand the nuances of your market.
Our approach integrates extensive primary research through direct engagement with industry participants and experts, complemented by comprehensive secondary research from verified global sources. We apply quantified impact analysis to deliver dependable forecasts, while maintaining complete traceability from original data sources to final insights.
2. Primary research
Primary research forms the backbone of our methodology, contributing nearly 80% to overall insights. It involves direct engagement with industry participants to ensure accuracy and depth in analysis. Our structured interview program covers regional and global markets, with inputs from C-suite executives, directors, and subject matter experts. These interactions provide strategic, operational, and technical perspectives, enabling well-rounded insights and reliable market forecasts.
3. Data mining & market analysis
Data mining is a key part of our research process, contributing nearly 20% to the overall methodology. It involves analysing market structure, identifying industry trends, and assessing macroeconomic factors through revenue share analysis of major players. Relevant data is collected from both paid and unpaid sources to build a reliable database. This information is then integrated to support primary research and market sizing, with validation from key stakeholders such as distributors, manufacturers, and associations.
4. Market sizing
Our market sizing is built on a bottom-up approach, starting with company revenue data gathered directly through primary interviews, alongside production volume figures from manufacturers and installation or deployment statistics. These inputs are then pieced together across regional markets to arrive at a global estimate that stays grounded in actual industry activity.
5. Forecast model & key assumptions
Every forecast includes explicit documentation of:
✓ Key growth drivers and their assumed impact
✓ Restraining factors and mitigation scenarios
✓ Regulatory assumptions and policy change risk
✓ Technology adoption curve parameter
✓ Macroeconomic assumptions (GDP growth, inflation, currency)
✓ Competitive dynamics and market entry/exit expectations
6. Validation & quality assurance
The final stages involve human validation, where domain experts manually review filtered data to identify nuances and contextual errors that automated systems might miss. This expert review adds a critical layer of quality assurance, ensuring data aligns with research objectives and domain-specific standards.
Our triple-layer validation process ensures maximum data reliability:
✓ Statistical Validation
✓ Expert Validation
✓ Market Reality Check
Trust & credibility
Verified data sources
Trade publications
Security & defense sector journals and trade press
Industry databases
Proprietary and third-party market databases
Regulatory filings
Government procurement records and policy documents
Academic research
University studies and specialist institution reports
Company reports
Annual reports, investor presentations, and filings
Expert interviews
C-suite, procurement leads, and technical specialists
GMI archive
13,000+ published studies across 30+ industry verticals
Trade data
Import/export volumes, HS codes, and customs records
Parameters studied & evaluated
Every data point in this report is validated through primary interviews, true bottom-up modelling, and rigorous cross-checks. Read about our research process →