
Authors:
Kiran Pulidindi, Riya Khandelwal
Download free PDF
Poly Aluminum Chloride Market Size & Share 2026-2035
Report ID: GMI2786
|
Published Date: August 2026
|
Report Format: PDF/Excel/Dashboard/Platform
Download Free PDF
Explore Our Licensing Options:
Immediate Delivery Available
Download Free PDF

Poly Aluminum Chloride Market
Get a free sample of this report
Get a free sample of this report Poly Aluminum Chloride Market
Is your requirement urgent? Please give us your business email
for a speedy delivery!
Poly Aluminum Chloride Market Size
The poly aluminum chloride market was valued at USD 1.83 billion in 2025 and is projected to reach USD 4.46 billion by 2035, expanding at an estimated 9.5% CAGR from 2026 to 2035. The market increased from USD 1.43 billion in 2022 to USD 1.68 billion in 2024 as municipal treatment systems, industrial discharge management, and higher-performance raw-water treatment sustained demand for aluminum-based coagulants.
Poly Aluminum Chloride Market Key Takeaways
Market Leader: Kemira Oyj led with over 16.5% market share in 2025.
Leading Players: Top 5 players in this market include Kemira Oyj, CHALCO Advanced Material Co., Ltd., USALCO, GEO Specialty Chemicals, Henan Yuanbo Environmental Technology Co., Ltd., which collectively held a market share of 46.5% in 2025.
PAC demand is anchored in its ability to destabilize suspended matter and form settleable flocs across a wide range of water matrices. The commercial value of that chemistry is increasingly determined by operating conditions rather than simple chemical volume: plants confronting variable turbidity, natural organic matter, color, or phosphorus loads require grades whose basicity, aluminum species distribution, and physical form fit existing dosing and solids-handling systems. The result is a market in which mainstream liquid PAC remains the principal volume platform, while high-basicity, composite, and application-specific products capture faster growth where treatment performance or residual-management requirements are more demanding.
GMI Analyst View
The market's projected expansion reflects a durable treatment-chemicals requirement, but the value pool is shifting toward products that reduce process instability rather than merely supply aluminum. Municipal investments create a broad demand base; the more consequential commercial opportunity lies where source-water variability, industrial wastewater complexity, or membrane protection makes grade selection and technical service part of the procurement decision. Suppliers that can support jar testing, reliable local inventory, and fit-for-purpose basicity are better positioned than suppliers competing only on quoted active-aluminum content.
Key Drivers
Water and wastewater infrastructure remains the central demand driver. India's AMRUT and AMRUT 2.0 programs had sanctioned 888 sewerage and septage-management projects worth INR 34,471.71 crore, while the country's estimated sewage generation of 72,368 MLD exceeded installed treatment capacity of 31,885.13 MLD [1]Ministry of Housing and Urban Affairs, Government of India, sansad.in. That capacity gap is consequential for PAC suppliers because construction of treatment capacity alone does not determine chemical demand; recurrent coagulant consumption begins when plants commission intake clarification, primary treatment, tertiary polishing, or sludge-conditioning systems. It also creates an operating requirement for suppliers able to provide consistent lots and application support as municipal operators work with highly variable influent quality.
Regulatory and technical standardization are broadening the addressable performance envelope for specialized PAC. China's HG/T 6280-2024, effective October 1, 2024, covers organic composite PAC made by combining PAC with PDADMAC for applications including coagulation and sedimentation, color and organic-matter removal, phosphorus removal, and sludge dewatering [2]National Digital Standards Library, ndls.cnis.ac.cn. The standard formalizes a product category that is intended for difficult, high-turbidity water and wastewater conditions, creating a clearer route to specify composite products instead of relying on conventional PAC alone.
Higher-grade and high-basicity products are supported by process innovations that change the coagulant's chemistry, rather than only its packaging. Electrodialysis can selectively remove hydrochloric acid and raise PAC basicity without metallic aluminum or alkali neutralization, reducing salt by-product formation in the patented process. At the formulation level, the relative abundance of hydrolyzed aluminum species changes the treatment outcome: Alb species are associated with dissolved organic carbon removal, while Alc species contribute to turbidity removal through adsorption. This provides a technical basis for demand growth in applications where operators must manage organics, color, and membrane-fouling precursors in addition to conventional suspended solids.
Key Restraints
PAC procurement remains exposed to a trade-off between treatment performance and delivered cost. Liquid PAC is economical for high-throughput users located near production or bulk-storage infrastructure, but its water content makes long-haul shipment less efficient than dry material. Powder and granular grades improve freight density and inventory flexibility, yet impose dissolution, handling, and dust-control requirements on end users. This fragmentation limits the ability of a single product form to displace the others across all geographies.
Technical upgrading also introduces qualification risk. High-basicity PAC and composite formulations can improve performance in specific raw-water conditions, but dosing cannot be generalized across sites. The electrodialysis route itself identifies membrane-fouling constraints at high basicity and aluminum concentrations, demonstrating that process performance depends on feed management and operating design. For buyers, the practical implication is that a higher-priced grade must demonstrate lower dosage, stronger removal, reduced sludge burden, or improved process stability through site-specific trials before it can be adopted at scale.
GMI Analyst View
Demand growth does not eliminate commoditization pressure in conventional PAC. Infrastructure-led volume favors dependable, competitively priced supply, while difficult-water applications reward treatment economics demonstrated at the plant level. This division will widen the commercial gap between suppliers that sell standardized material through distribution and those that can support formulation, dosage optimization, and dependable replenishment. The most defensible margin opportunities are therefore linked to verified treatment outcomes, not to an undifferentiated premium for high basicity.
Poly Aluminum Chloride Market Segment Analysis
By Form
Liquid PAC was the largest form segment, valued at USD 1.089 billion in 2025 and projected to reach USD 2.586 billion by 2035 at a 9.17% CAGR. Its installed-base advantage reflects direct bulk dosing in municipal and industrial plants, where avoiding on-site dissolution simplifies operation.
Powder PAC (spray-dried) is projected to grow from USD 0.462 billion to USD 1.159 billion at a 9.79% CAGR, while granular PAC rises at the fastest rate among forms, from USD 0.173 billion to USD 0.490 billion at an 11.16% CAGR. Granular products address users that need dry-material handling with improved storage and transport characteristics. Flaky PAC (drum-dried) grows more slowly, from USD 0.106 billion to USD 0.223 billion at a 7.78% CAGR, as its handling and reconstitution profile is less attractive for many modern treatment systems.
By Product Type
Conventional polyaluminum chloride remained the largest product type at USD 1.291 billion in 2025 and is forecast to reach USD 3.076 billion by 2035 at a 9.22% CAGR. PACS is expected to advance from USD 0.279 billion to USD 0.713 billion at a 10.00% CAGR, and ACH from USD 0.150 billion to USD 0.401 billion at a 10.45% CAGR. Their growth reflects demand for coagulants tailored to particular treatment conditions and higher-performance applications. Composite PAC is projected to expand from USD 0.071 billion to USD 0.156 billion, while Nano-PAC increases from USD 0.039 billion to USD 0.111 billion at an 11.10% CAGR.
Nano-PAC's growth profile is technically plausible where improved organic removal justifies formulation control. Research on hydrolyzed aluminum species distinguishes immediately reacting Ala, medium-polymer Alb, and colloidal Alc; Alb is linked to dissolved organic carbon removal, while Alc is associated with turbidity removal. A separate petrochemical-wastewater study reported Nano-PAC with 85% Alb content and near-complete turbidity removal at pH near 9 and a 20 mg/L dose in oil-separation-tank effluent [3]Su, X. et al., en.cnki.com.cn. These results are application-specific rather than a universal dosage benchmark, but they illustrate why specialized PAC is evaluated against contaminant profile and operating conditions.
By Grade
Food grade PAC led the grade segmentation at USD 1.002 billion in 2025 and is forecast to reach USD 2.408 billion by 2035 at a 9.30% CAGR. Drinking water grade PAC follows, increasing from USD 0.618 billion to USD 1.471 billion at a 9.21% CAGR. The combined scale of these grades indicates that human-contact water uses remain the market's principal quality anchor, where impurity control and consistent product specification matter as much as coagulation strength. Industrial grade PAC is expected to grow from USD 0.132 billion to USD 0.357 billion at a 10.59% CAGR, while filter grade PAC advances from USD 0.078 billion to USD 0.223 billion at an 11.23% CAGR, reflecting more specialized polishing and separation requirements.
By Basicity
Low-basicity PAC (30-50%) was the largest basicity segment at USD 0.764 billion in 2025 and is projected to reach USD 1.828 billion by 2035. Medium-basicity grades increase from USD 0.618 billion to USD 1.471 billion. Higher-basicity products account for a smaller base but faster value expansion: high-basicity PAC rises from USD 0.334 billion to USD 0.847 billion, and ultra-high-basicity PAC from USD 0.114 billion to USD 0.312 billion at a 10.71% CAGR. Basicity is commercially relevant because it affects hydrolysis behavior, dosage response, and compatibility with water characteristics; it should not be treated as a standalone quality ranking.
By Manufacturing Process
Spray drying technology accounted for USD 0.760 billion in 2025 and is projected to reach USD 1.783 billion in 2035, retaining the largest process position. Drum drying grows from USD 0.553 billion to USD 1.382 billion, while electrodialysis rises from USD 0.331 billion to USD 0.825 billion. The latter route is strategically relevant because it supports high-basicity PAC and ACH production with reduced salt-generation requirements in the disclosed process [4]Google Patents, patents.google.com. The acid-soluble aluminum ash method expands from USD 0.185 billion to USD 0.468 billion. Process choice therefore determines more than unit economics: it governs product form, aluminum concentration, basicity range, impurity-control capability, and the supplier's access to specialty specifications.
By End-User Industry
Water treatment was the largest end-user industry at USD 1.199 billion in 2025 and is forecast to reach USD 2.853 billion by 2035. The segment's scale stems from repeated chemical consumption in municipal drinking-water and wastewater operations. Pulp and paper increases from USD 0.270 billion to USD 0.624 billion, where PAC can support wet-end chemistry and effluent clarification. Textiles and pharmaceutical & cosmetics each grow at an 11.35% CAGR, reaching USD 0.334 billion and USD 0.223 billion, respectively. Oil and gas increases from USD 0.095 billion to USD 0.268 billion. These faster-growing industrial categories require suppliers to manage a more diverse range of contaminants and qualification requirements than conventional municipal clarification.
By Application
Coagulation and flocculation remained the largest application at USD 1.016 billion in 2025 and is projected to reach USD 2.408 billion by 2035. Sludge dewatering grows from USD 0.270 billion to USD 0.624 billion, while membrane pre-treatment advances from USD 0.150 billion to USD 0.401 billion.
Phosphorus removal is expected to rise from USD 0.132 billion to USD 0.357 billion, and organic matter and natural organic matter removal from USD 0.095 billion to USD 0.268 billion at an 11.00% CAGR. China's composite-PAC standard explicitly includes color, organic-matter, phosphorus-removal, and sludge-dewatering uses, indicating that coagulant product development is moving toward defined performance tasks rather than a single generic clarification claim.
GMI Analyst View
The segment outlook favors a barbell market. Large liquid and conventional-PAC volumes will continue to supply routine treatment demand, preserving the importance of manufacturing scale and distribution reliability. At the other end, dry, granular, high-basicity, ACH, composite, and Nano-PAC products expand faster because they solve operational problems that conventional grades may not address efficiently. Suppliers should evaluate portfolio breadth through the lens of application fit: a grade's value depends on whether it reduces dosage uncertainty, supports a specific removal target, or lowers total treatment-system burden.
Poly Aluminum Chloride Market Regional Analysis
Asia Pacific
Asia Pacific was the largest regional market, valued at USD 0.797 billion in 2025 and projected to reach USD 1.873 billion by 2035 at a 9.07% CAGR. The region combines large municipal-treatment needs with an extensive PAC manufacturing base, particularly in China, and rising industrial water-treatment requirements in India and Southeast Asia. India's documented sewage-treatment capacity gap and active sewerage project pipeline support recurring coagulant demand as treatment infrastructure is built and operated. China's HG/T 6280-2024 further supports development of composite PAC for demanding industrial and municipal applications.
North America
North America is expected to expand from USD 0.462 billion in 2025 to USD 1.159 billion by 2035 at a 9.79% CAGR. The U.S. accounted for USD 408.6 million in 2025, or approximately 88.5% of North American demand, and is projected to reach USD 1,025.9 million by 2035.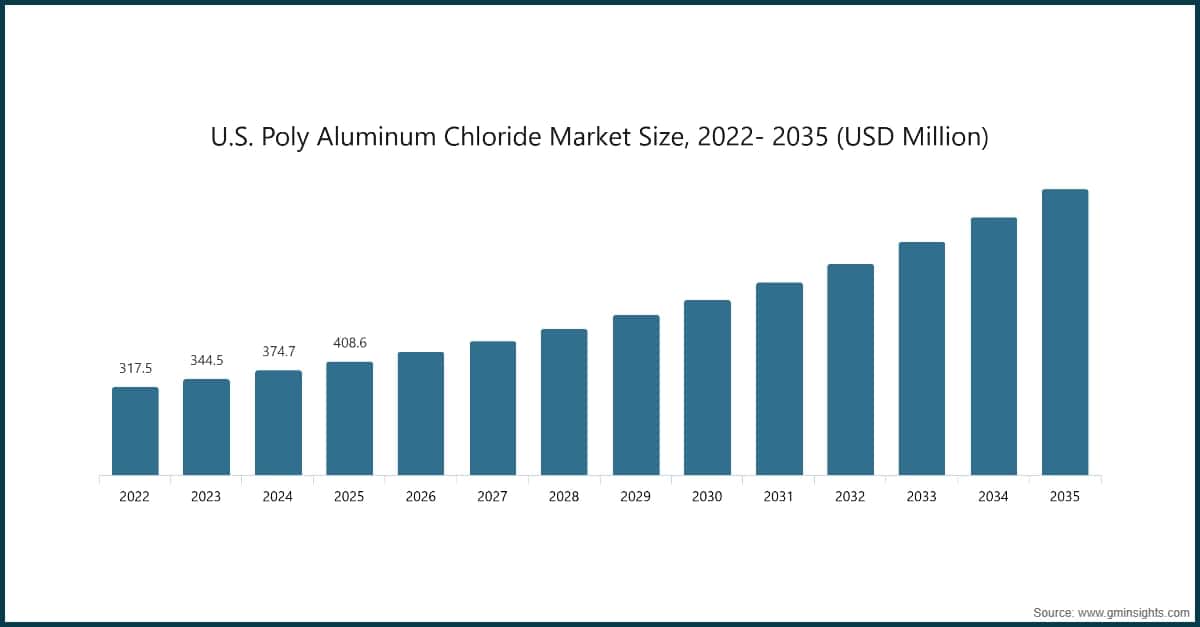
The region's value profile favors dependable supply, municipal qualification, and technical differentiation for industrial and high-performance water treatment. USALCO's 33 manufacturing and distribution facilities demonstrate the strategic importance of regional logistics coverage in serving North American municipal and commercial customers [5]H.I.G. Capital via Business Wire, businesswire.com.
Europe
Europe is forecast to grow from USD 0.382 billion in 2025 to USD 0.914 billion by 2035 at a 9.26% CAGR. The market's development is shaped by quality, environmental-management, and treatment-performance requirements. Danish supplier Alumichem's AluPAC is produced to EN 883 for chemicals used in treatment of water intended for human consumption, illustrating the importance of standards-compliant supply in the European drinking-water market [6]Alumichem A/S, alumichem.com. European suppliers with environmental certifications and compact, high-performance flocculation products may be particularly relevant where treatment works need to manage phosphorus, organic matter, or changing raw-water quality within established infrastructure.
Latin America
Latin America is the fastest-growing regional market, expanding from USD 0.114 billion in 2025 to USD 0.312 billion in 2035 at a 10.76% CAGR. Brazil and Mexico are central markets within the regional growth story. The opportunity is tied to water-security investment, urban wastewater treatment, and industrial water reuse, but deployment risk remains linked to procurement budgets, local chemical distribution, and the need to balance capital expenditure with long-term operating costs. Suppliers that can offer dry forms or regionally stocked liquid PAC have an advantage where cross-border freight and storage constraints affect delivered cost.
Middle East & Africa
Middle East & Africa is projected to increase from USD 0.076 billion in 2025 to USD 0.201 billion by 2035 at a 10.34% CAGR. Desalination, municipal supply security, and wastewater reuse underpin demand for pre-treatment and clarification chemicals. ACCIONA signed financing in May 2025 for the Casablanca seawater desalination plant in Sidi Rahal, Morocco; the project is planned at 300 million m³ per year and is scheduled for completion in 2028. Such large-scale reverse-osmosis developments reinforce the strategic importance of membrane pre-treatment, although chemical selection remains dependent on the plant's specific intake-water quality and treatment-train design.
GMI Analyst View
Regional growth rates conceal materially different purchasing models. Asia Pacific combines extensive production capacity with infrastructure-led demand, creating a competitive environment where cost, quality control, and local technical support all matter. North America and Europe place greater weight on supply assurance and qualification, while Latin America and Middle East & Africa offer faster growth but require logistics strategies suited to project-led and geographically dispersed demand. The practical implication for manufacturers is that regional expansion should be designed around form factor, inventory location, and service capability rather than export volume alone.
Poly Aluminum Chloride Market Share & Competitive Landscape
The top five suppliers collectively accounted for approximately 46.5% of the global PAC market in 2025. Kemira Oyj held an estimated 16.5% share, followed by CHALCO Advanced Material Co., Ltd. at 12.0%, USALCO at 8.5%, GEO Specialty Chemicals at 5.5%, and Henan Yuanbo Environmental Technology Co., Ltd. at 4.0%. The remaining market is fragmented among regional manufacturers, diversified chemical companies, traders, and specialty suppliers.
Kemira Oyj
Kemira's estimated 16.5% share reflects its scale in water-treatment chemistry and broad regional commercial reach. Its 2024 revenue was EUR 2,948.1 million, with EMEA representing 52% of revenue, the Americas 38%, and Asia Pacific 10% [7]Kemira Oyj, kemira.com. For PAC competition, the company's position is strengthened by its ability to combine chemical supply with water-treatment expertise across mature municipal and industrial markets.
CHALCO Advanced Material Co., Ltd.
CHALCO Advanced Material Co., Ltd. held an estimated 12.0% share in 2025. Its competitive relevance is tied to China's aluminum-materials ecosystem and the ability to participate in large-scale PAC supply. Its market position makes it a significant benchmark for cost-efficient production and broad regional availability.
USALCO
USALCO accounted for an estimated 8.5% share of global PAC demand in 2025 and serves municipal and commercial water-treatment customers across North America. On August 5, 2024, TJC, L.P. entered an agreement to acquire a controlling interest in USALCO from H.I.G. Capital, with H.I.G. retaining a minority stake [8]USALCO, LLC, usalco.com. The company operates 33 manufacturing and distribution facilities across North America. The transaction highlights the value of localized production and distribution infrastructure in a liquid-chemical market where delivered service is a core competitive asset.
GEO Specialty Chemicals
GEO Specialty Chemicals held an estimated 5.5% share in 2025. The company competes through its specialty-chemical orientation and participation in water-treatment supply, where the ability to support consistent quality and application-specific requirements differentiates suppliers from purely transactional distributors.
Henan Yuanbo Environmental Technology Co., Ltd.
Henan Yuanbo held an estimated 4.0% share in 2025 and is a focused Chinese water-treatment chemical producer headquartered in Zhengzhou, with production in Jiaozuo. The company states that it uses centrifugal spray-drying equipment and holds ISO 9001, ISO 14001, and ISO 45001 certifications. Its product range includes white and yellow drinking-water-grade PAC and yellow industrial-grade PAC, alongside PFS, PAM, aluminum sulfate, and related treatment chemicals. The company reports five factories, more than 10 production lines, and capacity of 500,000 MT of liquid PAC and 100,000 MT of solid PAC; these capacity figures are company-reported through a trade-directory listing and are not independently audited. Its use of jar testing to match grade and dosage to source-water conditions shows how technical support can complement scale in a fragmented supplier landscape.
Alumichem A/S
Alumichem is a Danish specialty-chemicals producer that began PAC production on a dedicated line in 2005. Its AluPAC portfolio conforms with EN 883, while its water-treatment offering includes PAC, ACH, sodium aluminate, and blended coagulant products. The company's Kalundborg production base and commercial offices in Belgium, Canada, and Ghana support a strategy centered on certified, high-performance aluminates rather than global commodity volume.
Biosynth
Biosynth's role is distinct from that of volume PAC manufacturers. Its Carbosynth FP31706 PAC is a ≥98% purity, powder-form research reagent supplied in 0.1 kg units and designated for laboratory use only, not commercial water-treatment use. The company is therefore relevant as a life-sciences and specialty-chemicals supplier with catalog PAC availability, rather than as a supplier of municipal-scale coagulant volumes.
EMCO Dyestuff
Mumbai-based EMCO Dyestuff supplies both powder and liquid PAC within a broader industrial-chemicals portfolio. Its powder PAC specifications include at least 30% Al₂O₃ and 40-90% basicity, while liquid PAC is specified at at least 10% Al₂O₃. EMCO's reported export reach across China, the U.S., Europe, Latin America, Pakistan, Bangladesh, and Far East markets provides a route to international customers, although PAC remains one product category within a diversified chemical offering.
Fengchen Group Co., Ltd.
Qingdao-based Fengchen Group supplies yellow PAC in 25 kg fiber drums as part of a broader portfolio covering pharmaceutical inputs, specialty chemicals, and industrial inorganic products. Its PAC is marketed for drinking-water purification, wastewater treatment, paper sizing, textile processing, and related industrial applications. The company's broad product slate indicates that its competitive role is as a multi-product exporter and supplier capable of serving smaller and customized orders rather than as a dedicated global coagulant specialist.
Henan Chemger Group Corporation
Henan Chemger is a Zhengzhou-based chemical raw-materials distributor and exporter with water-treatment chemicals positioned alongside polymers, pigments, resins, surfactants, and other industrial products. It offers PAC in solid and liquid forms, including drinking-water and industrial-wastewater grades, alongside aluminum sulfate and polyacrylamide. This bundled approach can simplify procurement for treatment-chemical distributors and operators, though no dedicated PAC production capacity has been publicly identified.
Kavya Pharma
Kavya Pharma, headquartered in Surat, India, supplies both sulphated and non-sulphated PAC grades, including medium- and high-basicity products. Its sulphated PAC is positioned for COD, BOD, and TOC reduction in municipal and industrial wastewater, while non-sulphated high-basicity material is marketed for drinking-water and sewage treatment. The company's export-focused orientation and pharmaceutical-chemicals background provide a differentiated route to customers seeking documented product specifications across specialty chemical categories.
N. R. CHEMICALS
N. R. CHEMICALS is a Dewas, India-based manufacturer and exporter offering PAC in liquid and powder forms together with chlorine, alum, polyacrylamide, lime, and other water-treatment chemicals. Its portfolio targets applications spanning potable-water purification and wastewater from textile, leather, food-processing, metallurgy, pharmaceutical, and paper-making operations. Its competitive role is primarily based on breadth of supply and availability in Indian and export-oriented water-treatment markets.
Taki Chemical
Taki Chemical developed and commenced commercial PAC manufacturing for water treatment in 1962 and has licensed PAC technology to producers in more than ten countries. Its product portfolio includes PAC250A, PAC300A, PAC250AD, and ultra-high-basicity PAC700A, with products governed by JIS K1475-1996 and JWWA K154 standards. On September 8, 2025, Taki announced an approximately JPY 300 million investment to double PAC700A capacity at its Kyushu Plant, with completion targeted for March 2027. The expansion shows how source-water-quality concerns can support targeted capacity additions in higher-basicity grades.
Venator Materials
Venator Materials is included among the authorized competitive set as a specialty-chemicals participant. Its competitive significance rests on specialty inorganic-chemicals capabilities and established industrial customer relationships, although no additional PAC-specific operating claim is retained here without directly mapped eligible evidence.
Recent Industry Developments
Need a specific section of this report?
Purchase regional analysis, country-level analysis, company profiles, or any other segment-level insights separately
based on your research needs.
Research methodology, data sources & validation process
This report draws on a structured research process built around direct industry conversations, proprietary modelling, and rigorous cross-validation and not just desk research.
Our 6-step research process
1. Research design & analyst oversight
At GMI, our research methodology is built on a foundation of human expertise, rigorous validation, and complete transparency. Every insight, trend analysis, and forecast in our reports is developed by experienced analysts who understand the nuances of your market.
Our approach integrates extensive primary research through direct engagement with industry participants and experts, complemented by comprehensive secondary research from verified global sources. We apply quantified impact analysis to deliver dependable forecasts, while maintaining complete traceability from original data sources to final insights.
2. Primary research
Primary research forms the backbone of our methodology, contributing nearly 80% to overall insights. It involves direct engagement with industry participants to ensure accuracy and depth in analysis. Our structured interview program covers regional and global markets, with inputs from C-suite executives, directors, and subject matter experts. These interactions provide strategic, operational, and technical perspectives, enabling well-rounded insights and reliable market forecasts.
3. Data mining & market analysis
Data mining is a key part of our research process, contributing nearly 20% to the overall methodology. It involves analysing market structure, identifying industry trends, and assessing macroeconomic factors through revenue share analysis of major players. Relevant data is collected from both paid and unpaid sources to build a reliable database. This information is then integrated to support primary research and market sizing, with validation from key stakeholders such as distributors, manufacturers, and associations.
4. Market sizing
Our market sizing is built on a bottom-up approach, starting with company revenue data gathered directly through primary interviews, alongside production volume figures from manufacturers and installation or deployment statistics. These inputs are then pieced together across regional markets to arrive at a global estimate that stays grounded in actual industry activity.
5. Forecast model & key assumptions
Every forecast includes explicit documentation of:
✓ Key growth drivers and their assumed impact
✓ Restraining factors and mitigation scenarios
✓ Regulatory assumptions and policy change risk
✓ Technology adoption curve parameter
✓ Macroeconomic assumptions (GDP growth, inflation, currency)
✓ Competitive dynamics and market entry/exit expectations
6. Validation & quality assurance
The final stages involve human validation, where domain experts manually review filtered data to identify nuances and contextual errors that automated systems might miss. This expert review adds a critical layer of quality assurance, ensuring data aligns with research objectives and domain-specific standards.
Our triple-layer validation process ensures maximum data reliability:
✓ Statistical Validation
✓ Expert Validation
✓ Market Reality Check
Trust & credibility
Verified data sources
Trade publications
Industry journals, trade publications, and specialized media.
Industry databases
Proprietary and third-party market databases
Regulatory filings
Government procurement records and policy documents
Academic research
University studies and specialist institution reports
Company reports
Annual reports, investor presentations, and filings
Expert interviews
C-suite, procurement leads, and technical specialists
GMI archive
13,000+ published studies across 20+ industry verticals
Trade data
Import/export volumes, HS codes, and customs records
Parameters studied & evaluated
Every data point in this report is validated through primary interviews, true bottom-up modelling, and rigorous cross-checks. Read about our research process →