Farm Equipment Rental Market Size & Share 2026-2035
Market Size by Equipment Type (Tractors, Harvesters, Sprayers, Balers) by Drive (4WD, 2WD), by Power Output (<30 HP, 31-70 HP, 71-130 HP, 131-250 HP.
Report ID: GMI6662
|
Published Date: February 2026
|
Report Format: PDF
Download Free PDF
Authors:
Avinash Singh, Sunita Singh


Farm Equipment Rental Market Size
The farm equipment rental market was estimated at USD 40.8 billion in 2025. The market is expected to grow from USD 43 billion in 2026 to USD 76.4 billion in 2035, at a CAGR of 6.6% according to latest report published by Global Market Insights Inc.
Farm Equipment Rental Market Key Takeaways
Market Size & Growth
Regional Dominance
Key Market Drivers
Challenges
Opportunity
Key Players
Farm Equipment Rental Market Trends
The farm equipment rental industry is witnessing robust growth, driven by rapid advancements in technology and the increasing adoption of flexible, digital service models. A key trend shaping the market is the integration of precision agriculture technologies into rental fleets. These technologies include GPS-enabled tractors, automated harvesters, smart sprayers, and drones equipped with advanced imaging systems. By incorporating such high-tech machinery, rental companies enable farmers to access state-of-the-art equipment without the financial burden of significant capital investments.
Additionally, the proliferation of digital platforms and mobile-based rental applications is transforming the market landscape. These platforms allow farmers to seamlessly browse available equipment, compare pricing options, schedule rentals, and arrange for doorstep delivery. This digital transformation enhances transparency, streamlines operations, and encourages broader adoption, particularly among small and mid-sized farmers who often face resource constraints. Furthermore, rental companies are diversifying their offerings by including specialized machinery designed for crop-specific requirements, such as rice transplanters, sugarcane harvesters, and cotton pickers. This diversification ensures that farmers can select precise tools tailored to each stage of the cultivation process, improving efficiency and productivity.
Farm Equipment Rental Market Analysis
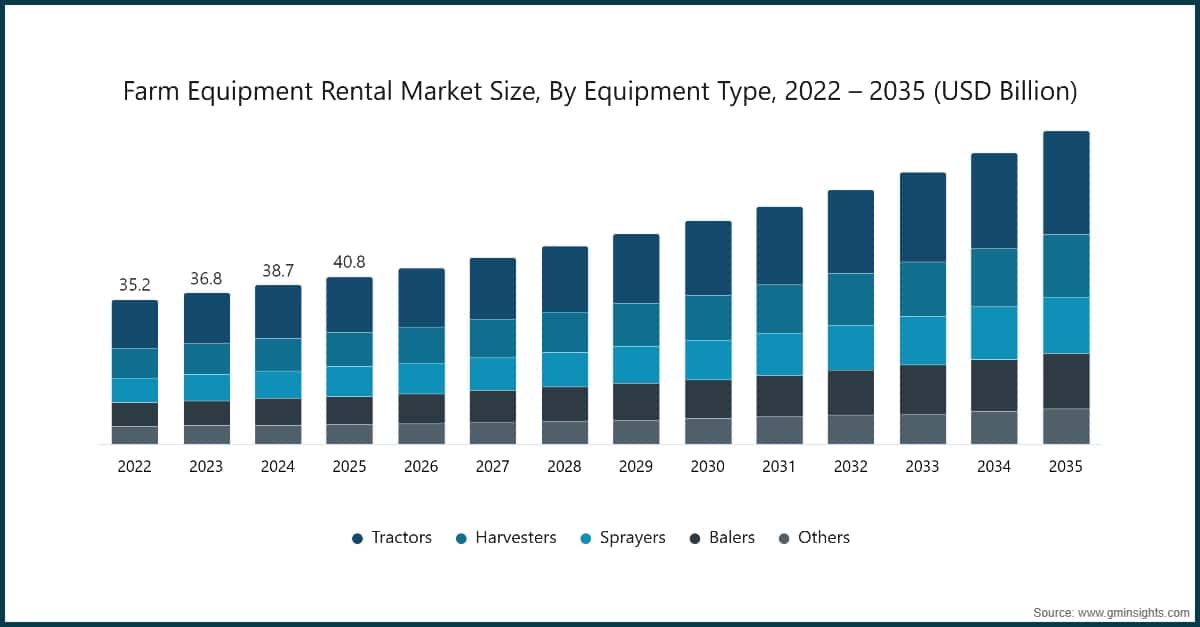
Based on equipment type, the market is categorized into tractors, harvesters, sprayers, balers and others. The tractors accounted for revenue of around USD 13.7 billion in 2025 and is anticipated to grow at a CAGR of 6.4% from 2026 to 2035.
Moreover, seasonal farming cycles create peak periods where temporary access to tractors becomes critical for timely operations, further boosting rental activity. The rise of precision agriculture and the need for compatible machinery capable of supporting digital tools and advanced implements also encourage farmers to rent updated tractors instead of buying older or less efficient ones.
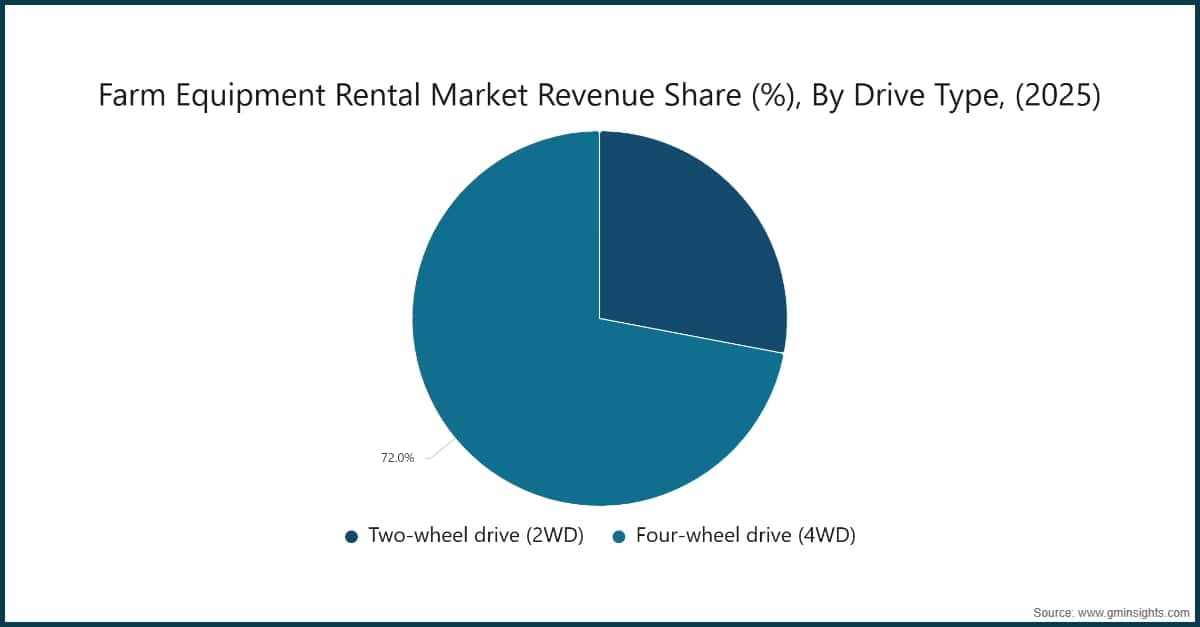
Based on drive type, the farm equipment rental market consists of two‑wheel drive (2WD) and four‑wheel drive (4WD). The four‑wheel drive (4WD) emerged as leader and held 72% of the total market share in 2025 and is anticipated to grow at a CAGR of 6.7% from 2026 to 2035.
North America Farm Equipment Rental Market
The U.S. dominates the overall North America farm equipment rental market and valued at USD 13.2 billion in 2025 and is estimated to grow at a CAGR of 6.3% from 2026 to 2035.
Europe Farm Equipment Rental Market
In the European market, Germany is expected to experience significant and promising growth from 2026 to 2035.
Asia Pacific Farm Equipment Rental Market
In the Asia Pacific market, the China held 34% share in 2025 and is anticipated to grow at a CAGR of 7.4% from 2026 to 2035.
Rapid mechanization, coupled with ongoing consolidation of farmland through cooperative farming models, is creating a higher demand for advanced machinery that many small and mid‑sized farmers cannot afford to purchase outright. Renting equipment allows these farmers to access modern technologies such as high‑horsepower tractors, precision sprayers, and specialized harvesting machines without bearing the burden of high capital investment or maintenance costs.
Middle East and Africa Farm Equipment Rental Market
In the Middle East and Africa market, Saudi Arabia held 32% market share in 2025.
Market share of ~15%
Collective market share of ~55%
Farm Equipment Rental Market Share
Farm Equipment Rental Market Companies
Major players operating in the farm equipment rental industry include:
CNH Industrial, through its renowned brands such as New Holland and Case IH, maintains its competitive edge by prioritizing the development of advanced smart farming technologies. The company continues to expand its diverse equipment portfolio, which includes tractors, harvesters, and specialized machinery designed to meet the evolving needs of modern agriculture. CNH Industrial places a strong emphasis on automation, electrification, and connected farming solutions, ensuring its offerings remain at the forefront of innovation.
Kubota Corporation strengthens its market position by focusing on compact machinery and advanced precision technologies tailored to meet the diverse requirements of global farming conditions. The company invests heavily in the development of fuel-efficient engines that reduce environmental impact, lightweight tractors that offer enhanced maneuverability, and autonomous machinery designed to optimize productivity on small to medium-sized farms. These segments are particularly significant as they dominate the demand for equipment rentals in many regions worldwide.
Farm Equipment Rental Industry News
The farm equipment rental market research report includes in-depth coverage of the industry, with estimates & forecast in terms of revenue (USD Billion) and volume (Units) from 2022 to 2035, for the following segments:
Click here to Buy Section of this Report
Market, By Equipment Type
Market, By Drive Type
Two‑wheel drive (2WD)
Four‑wheel drive (4WD)
Market, By Power Output
Market, By Rental Duration
Market, By Power Source
Market, By Application
Market, By End User
The above information is provided for the following regions and countries:
Research methodology, data sources & validation process
This report draws on a structured research process built around direct industry conversations, proprietary modelling, and rigorous cross-validation and not just desk research.
Our 6-step research process
1. Research design & analyst oversight
At GMI, our research methodology is built on a foundation of human expertise, rigorous validation, and complete transparency. Every insight, trend analysis, and forecast in our reports is developed by experienced analysts who understand the nuances of your market.
Our approach integrates extensive primary research through direct engagement with industry participants and experts, complemented by comprehensive secondary research from verified global sources. We apply quantified impact analysis to deliver dependable forecasts, while maintaining complete traceability from original data sources to final insights.
2. Primary research
Primary research forms the backbone of our methodology, contributing nearly 80% to overall insights. It involves direct engagement with industry participants to ensure accuracy and depth in analysis. Our structured interview program covers regional and global markets, with inputs from C-suite executives, directors, and subject matter experts. These interactions provide strategic, operational, and technical perspectives, enabling well-rounded insights and reliable market forecasts.
3. Data mining & market analysis
Data mining is a key part of our research process, contributing nearly 20% to the overall methodology. It involves analysing market structure, identifying industry trends, and assessing macroeconomic factors through revenue share analysis of major players. Relevant data is collected from both paid and unpaid sources to build a reliable database. This information is then integrated to support primary research and market sizing, with validation from key stakeholders such as distributors, manufacturers, and associations.
4. Market sizing
Our market sizing is built on a bottom-up approach, starting with company revenue data gathered directly through primary interviews, alongside production volume figures from manufacturers and installation or deployment statistics. These inputs are then pieced together across regional markets to arrive at a global estimate that stays grounded in actual industry activity.
5. Forecast model & key assumptions
Every forecast includes explicit documentation of:
✓ Key growth drivers and their assumed impact
✓ Restraining factors and mitigation scenarios
✓ Regulatory assumptions and policy change risk
✓ Technology adoption curve parameter
✓ Macroeconomic assumptions (GDP growth, inflation, currency)
✓ Competitive dynamics and market entry/exit expectations
6. Validation & quality assurance
The final stages involve human validation, where domain experts manually review filtered data to identify nuances and contextual errors that automated systems might miss. This expert review adds a critical layer of quality assurance, ensuring data aligns with research objectives and domain-specific standards.
Our triple-layer validation process ensures maximum data reliability:
✓ Statistical Validation
✓ Expert Validation
✓ Market Reality Check
Trust & credibility
Verified data sources
Trade publications
Security & defense sector journals and trade press
Industry databases
Proprietary and third-party market databases
Regulatory filings
Government procurement records and policy documents
Academic research
University studies and specialist institution reports
Company reports
Annual reports, investor presentations, and filings
Expert interviews
C-suite, procurement leads, and technical specialists
GMI archive
13,000+ published studies across 30+ industry verticals
Trade data
Import/export volumes, HS codes, and customs records
Parameters studied & evaluated
Every data point in this report is validated through primary interviews, true bottom-up modelling, and rigorous cross-checks. Read about our research process →