Authors:
Avinash Singh, Amit Patil
Download free PDF
Asia Pacific Cleaning Products Market Size & Share 2026-2035
Report ID: GMI15604
|
Published Date: February 2026
|
Report Format: PDF/Excel/Dashboard/Platform
Download Free PDF
Explore Our Licensing Options:
Immediate Delivery Available
Jump to Content
Market Size
Market Trends
Market Analysis
Market Share
Market Companies
Industry News
Table of Contents
Frequently Asked Questions
Research Methodology
Related Reports
Download Free PDF

Asia Pacific Cleaning Products Market
Get a free sample of this report
Get a free sample of this report Asia Pacific Cleaning Products Market
Is your requirement urgent? Please give us your business email
for a speedy delivery!
Asia Pacific Cleaning Products Market Size
The Asia Pacific cleaning products market was estimated at USD 117.2 billion in 2025. The market is expected to grow from USD 123.5 billion in 2026 to USD 207.3 billion in 2035, at a CAGR of 5.9% according to latest report published by Global Market Insights Inc.
Asia Pacific Cleaning Products Market Key Takeaways
Market Leader: Unilever led with over 6% market share in 2025.
Leading Players: Top 5 players in this market include Unilever, Procter & Gamble (P&G), Reckitt Benckiser Group, SC Johnson, Kao Corporation, which collectively held a market share of 25% in 2025.
The fast-changing lifestyles, urbanization, and growing emphasis on cleanliness throughout homes, workplaces and public spaces are all factors reflected in the accelerating pace of growth of the Asia Pacific cleaning products market. As urban regions continue to expand and living environments become more compact, the demand for products that facilitate more consistent and timely cleaning at home and in the workplace has increased. As a result, brands have expanded their product lines to include a variety of cleaning products from general-purpose cleaners to specialty cleaners for kitchens, bathrooms and textiles that are associated with performance and trust.
Cultural practices will also continue to influence the demand for cleaning products, as consumers' daily cleaning habits and routines vary by country. This has led many brands to modify the types of scents, sizes of products, and styles of use based on each country's preferences. With the rising levels of awareness regarding personal health and hygiene over the past decade and particularly during the recent COVID-19 pandemic, there has been a focus on how infectious diseases can be transmitted in shared spaces such as schools and mass transit. Institutional buyers (e.g., schools, offices, transportation) have therefore indicated an increased focus on providing safe and consistent cleaning of their facilities.
In addition, there is a trend toward purchasing cleaning products perceived as safe for both the family and the environment. Buyers are more likely to review product ingredients and packaging, and many are supporting brands that share their value system. Local manufacturers continue to have significant impact due to their knowledge of their region's needs, but global brands are growing their share of the market through innovation and an efficient distribution network.
Asia Pacific Cleaning Products Market Trends
The Asia Pacific cleaning products industry is experiencing dynamic shifts, driven by evolving consumer behaviors, technological advancements, and a heightened focus on sustainability and health.
Asia Pacific Cleaning Products Market Analysis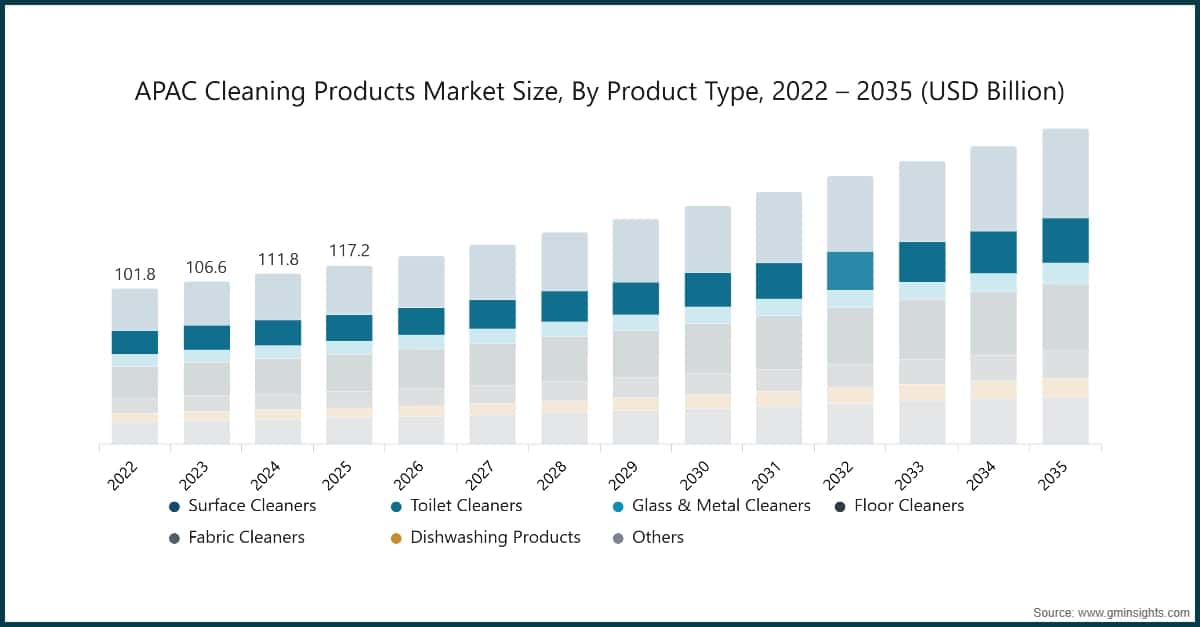
Based on product type, the market is surface cleaners, toilet cleaners, glass & metal cleaners, floor cleaners, fabric cleaners, dishwashing products, and others. In 2025, surface cleaners held the major market share, generating a revenue of USD 32.3 billion.
Based on end use, the market is segmented into household, commercial, and industrial. The household segment held the largest share, accounting for 48% of the Asia Pacific cleaning products market in 2025.
Based on ingredients, the Asia Pacific cleaning products market is segmented into organic and synthetic. In 2025, synthetic dominate the market with highest market share.
In 2025, the China dominated the Asia Pacific Cleaning products market, accounting for around 33% and generating around USD 39 billion revenue in the same year.
Asia Pacific Cleaning Products Market Share
Unilever is leading with 6% market share. Unilever, Procter & Gamble (P&G), Reckitt Benckiser Group, SC Johnson, Kao Corporation collectively hold around 25%, indicating moderately fragmented market concentration. These prominent players are proactively involved in strategic endeavors, such as mergers & acquisitions, facility expansions & collaborations, to expand their product portfolios, extend their reach to a broad customer base, and strengthen their market position.
Asia Pacific Cleaning Products Market Companies
Major players operating in the Asia Pacific cleaning products industry are:
SC Johnson is a privately held global manufacturer of household cleaning supplies and other consumer chemical products. In Asia Pacific, their strong portfolio includes well-known brands like Windex, Pledge, and Mr Muscle. SC Johnson's ability to offer specialized cleaning solutions, coupled with a focus on product innovation and adapting to regional consumer demands for convenience and effectiveness, ensures their continued relevance and market presence across diverse sub-markets.
Kao Corporation is a Japanese chemical and cosmetics company with a substantial presence in the home care sector. In Asia Pacific, Kao leverages its strong Japanese heritage and commitment to research and development for brands like Attack (detergent) and Magiclean. Their focus on high-quality, efficient, and often concentrated formulations, tailored for Asian living conditions and preferences, grants them a significant and respected position in the region's cleaning products market.
6% market share
Consolidate share of 25%
Asia Pacific Cleaning Products Industry News
The Asia Pacific cleaning products market research report includes in-depth coverage of the industry with estimates & forecasts in terms of revenue (USD Billion) and volume (Thousand Units) from 2022 to 2035, for the following segments:
Click here to Buy Section of this Report
Market, By Product Type
Market, By Ingredient
Market, By Price Range
Market, By End User Industry
Market, By Distribution Channel
The above information is provided for the following regions and countries:
Table of Contents
Chapter 1 Methodology and Scope
Chapter 2 Executive Summary
Chapter 3 Industry Insights
Chapter 4 Competitive Landscape, 2025
Chapter 5 Market Estimates & Forecast, By Product Type, 2022-2035 (USD Billion) (Thousand Units)
Chapter 6 Market Estimates & Forecast, By Ingredient, 2022-2035 (USD Billion) (Thousand Units)
Chapter 7 Market Estimates & Forecast, By Price Range, 2022-2035 (USD Billion) (Thousand Units)
Chapter 8 Market Estimates & Forecast, By End Use, 2022-2035 (USD Billion) (Thousand Units)
Chapter 9 Market Estimates & Forecast, By Distribution Channel, 2022-2035 (USD Billion) (Thousand Units)
Chapter 10 Market Estimates and Forecast, By Region, 2022 – 2035 (USD Billion) (Thousand Units)
Chapter 11 Company Profiles
Don't see your key competitors?
The companies listed in this report are a curated selection - not the full competitive universe.
Our market revenue calculations use a bottom-up methodology that accounts for all players across all regions - including manufacturers, distributors, and specialists not individually profiled. The profiles section spotlights strategically significant players; it does not define the scope of our market sizing.
Your competitive landscape may also include
Free customization - up to 20% of report value
Need specific data? Request customization and get the insights tailored to your exact requirements.
Research methodology, data sources & validation process
This report draws on a structured research process built around direct industry conversations, proprietary modelling, and rigorous cross-validation and not just desk research.
Our 6-step research process
1. Research design & analyst oversight
At GMI, our research methodology is built on a foundation of human expertise, rigorous validation, and complete transparency. Every insight, trend analysis, and forecast in our reports is developed by experienced analysts who understand the nuances of your market.
Our approach integrates extensive primary research through direct engagement with industry participants and experts, complemented by comprehensive secondary research from verified global sources. We apply quantified impact analysis to deliver dependable forecasts, while maintaining complete traceability from original data sources to final insights.
2. Primary research
Primary research forms the backbone of our methodology, contributing nearly 80% to overall insights. It involves direct engagement with industry participants to ensure accuracy and depth in analysis. Our structured interview program covers regional and global markets, with inputs from C-suite executives, directors, and subject matter experts. These interactions provide strategic, operational, and technical perspectives, enabling well-rounded insights and reliable market forecasts.
3. Data mining & market analysis
Data mining is a key part of our research process, contributing nearly 20% to the overall methodology. It involves analysing market structure, identifying industry trends, and assessing macroeconomic factors through revenue share analysis of major players. Relevant data is collected from both paid and unpaid sources to build a reliable database. This information is then integrated to support primary research and market sizing, with validation from key stakeholders such as distributors, manufacturers, and associations.
4. Market sizing
Our market sizing is built on a bottom-up approach, starting with company revenue data gathered directly through primary interviews, alongside production volume figures from manufacturers and installation or deployment statistics. These inputs are then pieced together across regional markets to arrive at a global estimate that stays grounded in actual industry activity.
5. Forecast model & key assumptions
Every forecast includes explicit documentation of:
✓ Key growth drivers and their assumed impact
✓ Restraining factors and mitigation scenarios
✓ Regulatory assumptions and policy change risk
✓ Technology adoption curve parameter
✓ Macroeconomic assumptions (GDP growth, inflation, currency)
✓ Competitive dynamics and market entry/exit expectations
6. Validation & quality assurance
The final stages involve human validation, where domain experts manually review filtered data to identify nuances and contextual errors that automated systems might miss. This expert review adds a critical layer of quality assurance, ensuring data aligns with research objectives and domain-specific standards.
Our triple-layer validation process ensures maximum data reliability:
✓ Statistical Validation
✓ Expert Validation
✓ Market Reality Check
Trust & credibility
Verified data sources
Trade publications
Security & defense sector journals and trade press
Industry databases
Proprietary and third-party market databases
Regulatory filings
Government procurement records and policy documents
Academic research
University studies and specialist institution reports
Company reports
Annual reports, investor presentations, and filings
Expert interviews
C-suite, procurement leads, and technical specialists
GMI archive
13,000+ published studies across 30+ industry verticals
Trade data
Import/export volumes, HS codes, and customs records
Parameters studied & evaluated
Every data point in this report is validated through primary interviews, true bottom-up modelling, and rigorous cross-checks. Read about our research process →