Home > Chemicals & Materials > Advanced Materials > Functional Materials > Hollow Glass Microspheres Market
Hollow Glass Microspheres Market Analysis
- Report ID: GMI256
- Published Date: Jul 2020
- Report Format: PDF
Hollow Glass Microspheres Market Analysis
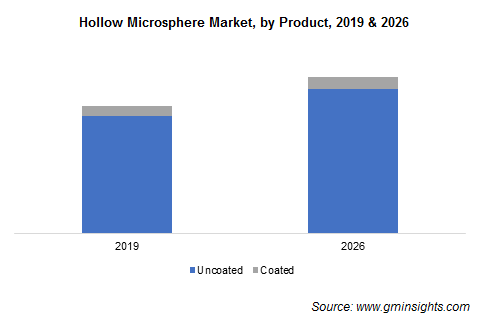
Multiple types of hollow glass microspheres are available in the industry depending on the application of the product in specific industry. these microspheres can be coated and uncoated. Uncoated hollow microsphere will hold a majority share of over 90% in 2026. Uncoated glass microsphere has a high demand in the hollow glass microspheres market due to its less price and high benefits.
High temperature operation, chemical stability, & high temperature operation of glass, low density, as well as lightweight functionality make the product highly in a wide range of applications.

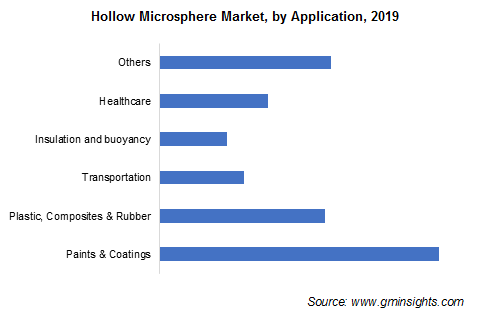
ollow microsphere systems have ample applications in paints & coatings, transportation, healthcare, and many more. Hollow glass microspheres market share from paints & coatings applications was close to 30% in 2019. In recent years, materials containing hollow glass and ceramic microspheres have been attracting considerable attention. These materials have quite good heat-insulation properties, which are mostly known by their special characteristics of absorption and scattering of thermal radiation by hollow particles.
The product has been used in various applications in paints and coatings sector for reducing heat loss from the walls of buildings attributed to the ability to cause a decline in thermal radiations.
Hollow ultra-low-density microspheres can be used as fillers in waterproof coatings to improve a number various properties of applied coating. Hollow microspheres also help in reflecting solar radiations and hence reducing the temperature in roof coatings. This can help in improving the overall indoor climate of buildings even without any air conditioning system. It saves energy by reducing the requirement for air conditioning. From single homes to large industries, the hollow glass microspheres have established its presence.

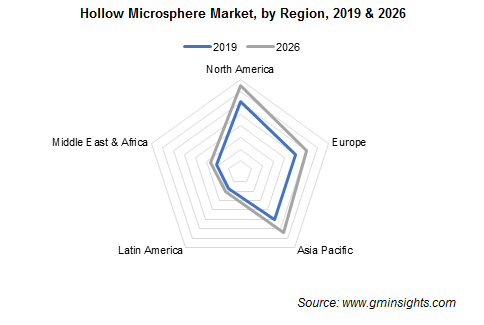
North America has the largest share in demand of hollow glass microsphere worldwide led by the U.S. Growing construction sector in the region due to increase in technological innovation is projected to boost vibration isolation in North America. The hollow glass microspheres market in the region is mainly, driven by rising investment in residential construction segment and growing demand for remodeling the old buildings. However, due to ongoing global crises, the demand in region will be on a lower side in the year 2020 due to dampening construction activities.
The regional demand is led by strict regulations regarding energy efficiency of buildings coupled with awareness of hollow microsphere. Furthermore, flourishing oil & gas industry, which is triggering continuous hike in drilling activities is another reason responsible for increased the hollow glass microspheres market demand from the region.

