Authors:
Rahul Varpe, Shishanka Wangnoo
Download free PDF
Dental Chair Market Size & Share 2026-2035
Report ID: GMI3446
|
Published Date: August 2026
|
Report Format: PDF/Excel/Dashboard/Platform
Download Free PDF
Explore Our Licensing Options:
Download Free PDF
Dental Chair Market
Get a free sample of this report
Get a free sample of this report Dental Chair Market
Is your requirement urgent? Please give us your business email
for a speedy delivery!

Dental Chair Market Size
The dental chair market was valued at USD 2.1 billion in 2025 and is projected to grow from USD 2.2 billion in 2026 to USD 4 billion by 2035, reflecting a 6.9% CAGR. Demand is anchored in the replacement and expansion cycle of dental operatories rather than in chair volume alone: practices increasingly specify seating, delivery systems, lighting, controls, waterline management, and digital-device compatibility together. This makes the chair a workflow platform whose value rises with procedure complexity and the degree of operatory integration.
Dental Chair Market Key Takeaways
Market Leader: Dentsply Sirona led with over 12% market share in 2025.
Leading Players: Top 5 players in this market include Dentsply Sirona, PLANMECA, A-dec, Midmark, alliage, which collectively held a market share of 28% in 2025.
Oral disease creates the underlying treatment requirement. The World Health Organization estimates that oral diseases affect 3.5 billion people, while untreated dental caries affects 2.5 billion people and severe gum disease affects roughly 1 billion people [1]World Health Organization, who.int. The commercial consequence is uneven by setting. Basic restorative and examination demand supports versatile general-practice installations, whereas implant, endodontic, and aesthetic workflows increase the value placed on repeatable positioning, clinician access, and compatibility with imaging and motor systems.
The market also reflects a split between high-specification replacement demand in established practices and new-operatory demand in developing regions. Integrated systems can improve instrument reach and reduce changes between procedures, but they require more capital planning, service support, and facility readiness than standalone equipment. Suppliers that can configure the operatory around local clinical mix and financing constraints are therefore better positioned than suppliers offering a single standard chair architecture.
GMI Analyst View
The 6.9% forecast is not solely a function of rising patient need; it depends on the conversion of that need into equipped treatment capacity. Disease burden sustains the clinical case for investment, while clinic expansion, dental tourism, and digital workflows determine whether purchasers select basic seating, a modular delivery system, or a fully integrated chair. This distinction matters because the fastest-growing demand pools may not produce the highest value per installation.
Key Drivers
Increasing prevalence of oral health disorders
Oral disease enlarges the pool of patients requiring examination, restoration, periodontal care, and prosthetic treatment. Global oral-condition cases rose from 3.62 billion in 2019 to 3.73 billion in 2023, with the largest percentage increase recorded in Sub-Saharan Africa [2]Institute for Health Metrics and Evaluation, healthdata.org. That trend supports chair demand not merely through treatment volume, but through a greater need for operatories that can accommodate longer restorative sessions and a wider mix of procedures. The effect is strongest where workforce and clinic capacity are expanding alongside disease detection.
Population aging intensifies this requirement. Complete tooth loss affects nearly 23% of adults aged 60 years or older globally, compared with approximately 7% of adults aged 20 years or older. Older patients often require restorative, prosthetic, or surgical interventions that place a premium on stable positioning, accessibility, and patient comfort. This favors non-portable and powered systems in established facilities, even as lower-cost configurations remain important for primary-care expansion.
Rise in medical tourism
Dental tourism concentrates equipment investment in clinics competing for cross-border patients. CareQuest estimates that the global dental-tourism market reached USD 10.9 billion in 2023, and cost savings were the primary motivation for 58% of U.S. adults who had sought dental care outside the country [3]CareQuest Institute for Oral Health, carequest.org. For destination clinics, the chair is part of the service proposition: it must support high patient turnover while accommodating implant, restorative, and aesthetic procedures that may be delivered in compressed treatment schedules.
The procurement effect is geographically concentrated rather than global. Dental work represented 55% of procedures reported by U.S. medical tourists in a population-based study, and Mexico accounted for 41% of reported trips. Providers in Mexico, Brazil, India, Thailand, South Korea, and Turkey have stronger incentives to standardize operatories and maintain treatment consistency for international patients. That can favor integrated units and dependable after-sales service over the lowest initial purchase price.
Increasing awareness of dental aesthetics
Aesthetic treatment changes the technical requirements placed on a dental chair because scanning, imaging, shade assessment, and prolonged consultations must coexist with patient positioning. Teeth whitening was the most frequently requested cosmetic dental treatment in the U.S. in 2022, according to the American Academy of Cosmetic Dentistry. Although whitening itself does not require a premium operatory, its role as an entry point can increase demand for aligner, veneer, restorative, and implant consultations.
Digital workflow adoption reinforces this mechanism. A transnational survey found that 78.8% of dental professionals used intraoral scanners in daily work, with 51.5% using them every day. Chairs that accommodate scanner access, display placement, and delivery-system integration can reduce friction in these workflows. The implication is not that every aesthetic practice requires a fully integrated unit, but that modularity and digital compatibility become material purchase criteria in high-value urban practices.
Surge in dentist workforce and infrastructure spending in developing regions
Expanding clinician capacity creates an equipment multiplier: each new practice, chairside room, or specialty center requires an operatory that can match its service mix. In Saudi Arabia, the dental workforce increased from 18,813 dentists in 2019 to 25,970 in 2023. India illustrates the parallel clinic-network model; Clove Dental operated more than 400 company-owned and operated clinics when Qatar Investment Authority invested USD 50 million in its parent company in 2023.
The opportunity is tempered by distribution gaps. Africa had 56,772 oral-health professionals in 2022, leaving a shortfall of 219,121 relative to the workforce required to meet the cited universal-health-coverage target. This supports demand for accessible equipment and mobile care models, but it also means that equipment suppliers must solve for training, field service, and local financing rather than treating workforce growth as an automatic conversion into premium-chair sales.
Key Restraints
High cost of dental chairs
The capital hurdle is greatest when the purchase extends beyond seating into an integrated operatory. A premium configuration can require not only the chair and delivery system, but also installation, compressed-air and suction compatibility, infection-control features, digital peripherals, staff training, and service coverage. This creates a different buying decision from replacing a basic chair, particularly for independent practices and facilities in markets with limited equipment financing.
Cost sensitivity does not eliminate demand; it changes specification. Purchasers may defer a fully integrated system, choose a non-powered or portable configuration, or favor a modular system that permits incremental upgrades. Manufacturers consequently face a trade-off between protecting premium-system margins and offering configurations that allow clinics to enter the market without sacrificing future interoperability.
Patient apathy and dental procedure avoidance
Avoidance limits chair utilization, which can delay equipment replacement even when clinical need is substantial. Only 45% of the U.S. population visited a dentist in 2022, and 13% reported cost barriers to dental care, compared with 4-5% for other healthcare. The effect on chair demand is indirect but important: underused schedules make practice owners less willing to commit to high-value operatories, while fully booked practices have a clearer financial case for upgrading.
Fear and delayed attendance add another layer. A systematic review estimated adult dental fear and anxiety at 15.3% globally, with severe fear or phobia affecting 3.3% [4]PubMed, pubmed.ncbi.nlm.nih.gov. In England, 40% of dentate adults reported moderate dental anxiety and 15% reported extreme anxiety in 2023. Patient-comfort features can support treatment acceptance, but they cannot by themselves overcome affordability, access, and anxiety barriers; providers must first convert intermittent care into regular attendance.
GMI Analyst View
Demand conditions are favorable, but the purchasing chain contains two separate conversion risks: a patient must enter care, and the provider must translate patient throughput into a justified capital investment. Disease prevalence supports the first condition only partially, because anxiety and affordability suppress utilization. Workforce and clinic-network expansion support the second, but capital intensity can push practices toward staged or lower-specification purchases.
Dental Chair Market Segment Analysis
By Product
Dental chair mounted units held a 46.6% market share in 2025. Their lead reflects the operational value of placing chairside instruments, controls, suction, and delivery components within one coordinated workstation. For clinics with steady examination and restorative traffic, integration can reduce setup variation between patients and improve clinician reach. The segment is therefore particularly relevant to practices seeking repeatable workflows rather than a stand-alone seating solution.
Ceiling mounted chairs are projected to reach USD 1.6 billion by 2035, expanding at a 6.9% CAGR. Overhead architecture can preserve floor access around the patient and facilitate organized instrument placement, making it suitable for space-constrained but high-throughput operatories. Mobile independent chairs are expected to reach USD 484.7 million by 2035 at a 5.8% CAGR; their lower-growth profile reflects their value in outreach, satellite, and small-practice settings where portability and installation simplicity matter more than maximum integration.
By Technology
Powered dental chairs accounted for 72.5% of the market in 2025. Their position is tied to controlled positioning and compatibility with advanced clinical workflows, particularly where practitioners use repeated preset positions during restorative, surgical, or specialty procedures. The value proposition is ergonomic as well as technical: efficient access to the oral cavity can reduce operator repositioning during long appointments.
Non-powered chairs are projected to grow at a 6.4% CAGR to USD 1.1 billion by 2035. Their continued relevance demonstrates that automation is not the only purchasing criterion. Clinics with basic procedure mixes, constrained power infrastructure, or limited maintenance resources can prioritize simpler mechanisms and lower lifecycle complexity. This creates an enduring market for suppliers that can distinguish necessary functionality from unnecessary specification.
By Configuration
Non-portable chairs represented 87.4% of the market in 2025 because fixed operatories remain the dominant setting for routine, restorative, and surgical dental care. General dental, pediatric, and exodontics configurations allow a fixed platform to be tailored to patient population and procedure type. The core advantage is stability and compatibility with surrounding equipment, which becomes more valuable as an operatory's diagnostic and treatment tools multiply.
Portable chairs are projected to reach USD 455.6 million by 2035, advancing at a 5.8% CAGR. Their strategic role is access expansion rather than direct substitution for a full clinic installation. Mobile services, remote communities, school programs, and temporary care settings can use portability to extend preventive and basic treatment capacity, although clinical scope and integration remain narrower than in a conventional operatory.
By Application
Examination applications accounted for 64.4% of the market in 2025. Routine examinations create the broadest installed base because every dental pathway begins with assessment, imaging, or preventive care. Chairs in these settings are purchased for patient comfort, clinician access, and rapid turnover, often with sufficient integration to support diagnostic tools rather than a full surgical workflow.
Surgical applications are projected to grow at a 6.3% CAGR and reach USD 1.4 billion by 2035. This segment requires greater attention to stability, positioning precision, and compatibility with surgical equipment. Its expansion indicates that suppliers can capture disproportionate value by supporting complex procedures, but only where the provider has the clinical volume and supporting infrastructure needed to justify a specialized operatory.
By Dental Specialty
General practice held a 67.6% market share in 2025, reflecting the breadth of routine examinations, preventive services, restorations, and referrals handled in primary dental settings. The optimal chair for this segment is versatile rather than procedure-exclusive, enabling a clinic to manage varied daily schedules without repeatedly changing room configuration.
Pediatric dentistry is forecast to expand at an 8.0% CAGR to USD 384.4 million by 2035, the fastest growth among the specified specialties. Pediatric configurations must address smaller patient size, safety, and anxiety management, which makes comfort and positioning more than cosmetic features. Oral and maxillofacial surgery, orthodontics and dentofacial orthopedics, dental pathology, and other specialties create narrower but important requirements for stability, access, and specialty-compatible instrumentation.
By End Use
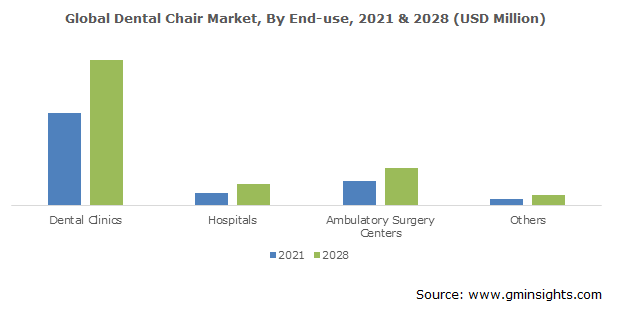
Dental clinics accounted for 67.9% of the market in 2025. Clinics combine the broad procedure mix of general practice with a direct link between room utilization and equipment investment, making them the primary channel for both new installations and upgrades. Their purchasing behavior favors systems that balance ergonomic performance, serviceability, and adaptation to changing treatment offerings.
Hospitals are projected to grow at a 7.6% CAGR to USD 382.1 million by 2035, while ambulatory surgery centers are expected to reach USD 759.3 million at a 7.0% CAGR. Hospital demand is shaped by multidisciplinary care and complex-case support; ambulatory surgery centers emphasize efficient patient flow and procedural readiness. Other end users, including academic and specialty facilities, add demand for training and specialized clinical environments but remain smaller in aggregate.
GMI Analyst View
Segment performance shows that integration is the principal value-creation axis, while portability is the principal access-expansion axis. Dental chair mounted units, powered systems, and non-portable configurations lead because they serve the installed base of fixed practices where equipment can be integrated into a repeatable workflow. Their position is reinforced when providers add imaging, scanning, or specialty procedures to an existing operatory.
Dental Chair Market Regional Analysis
North America
North America accounted for approximately 23% of the dental chair market in 2025, valued at USD 478.3 million. The U.S. market was valued at USD 427.1 million in 2025 and is projected to expand at a 6.4% CAGR through 2035. Replacement demand is supported by mature practices, but aging-related treatment needs remain a material factor: 19.7% of U.S. adults aged 75 years or older were edentulous in 2017-March 2020 [5]Centers for Disease Control and Prevention, cdc.gov. This supports demand for restorative and prosthetic workflows that require reliable patient positioning and clinician access.
Corporate-practice expansion can concentrate procurement. Heartland Dental had more than 1,700 offices and added more than 130 locations in 2024, while approximately 23% of U.S. dentists were reported to be affiliated with a dental service organization [6]Becker's Dental Review, beckersdental.com. Multi-site operators can favor standard equipment specifications, centralized service arrangements, and predictable installation schedules, increasing the importance of dealer reach and lifecycle support.
Europe
Europe was the largest regional market in 2025, valued at USD 734.6 million. The region's installed practice base and emphasis on digital workflows support replacement and upgrade activity. Digital dentistry adoption in Western Europe has been described as growing rapidly through aggressive workflow digitization. This creates demand for operatories that can accommodate scanners, imaging, and digitally coordinated treatment planning without requiring disruptive room redesign.
Clinical demand is broad, but access conditions vary. European studies estimate dental trauma prevalence among school-age children at approximately 19-37%, depending on country and methodology. At the same time, cost can delay care: 30% of adults in England reported that cost influenced their care choices in 2023, and 23% had delayed treatment because of cost. For chair suppliers, this combination favors systems that support preventive and restorative throughput while allowing practices to stage capital upgrades.
Asia Pacific
Asia Pacific was valued at USD 628.4 million in 2025 and is projected to record an 8.0% CAGR through 2035, the highest among the major regions. The demographic backdrop is unusually strong: the region had 670 million people aged 60 years or older in 2022, a figure projected to reach 1.3 billion by 2050. Aging raises demand for restorative and prosthetic care, while the region's wide variation in provider density and household affordability prevents a single equipment model from dominating all markets.
South-East Asia's oral-disease burden adds urgency to capacity expansion. The World Health Organization reported more than 900 million cases of untreated caries, severe periodontal disease, and edentulism in the region. Investment in clinic networks can accelerate equipment deployment, as illustrated by the more than 400 clinics operated by Clove Dental in India. The commercial opportunity is thus strongest for suppliers that can combine scalable clinic-standardization programs with product tiers appropriate to local capital constraints.
Latin America
Latin America was valued at USD 152.0 million in 2025. Brazil's 2023 national oral-health survey found edentulism in 36.5% of elderly people, severe tooth loss in 48.1%, and lack of functional dentition in 72.9%. These indicators point toward a persistent need for restorative and prosthetic treatment capacity even though edentulism has improved from historical levels.
Mexico's role in cross-border dental care adds a second demand channel. U.S. medical-tourism data show Mexico as the most frequently reported destination for Americans seeking care abroad. Tourism-oriented clinics may prioritize integrated, patient-facing operatories, while the broader regional market remains sensitive to acquisition cost, import logistics, and availability of local service. This divergence supports a two-track product strategy rather than a uniform premium offering.
Middle East and Africa
The Middle East and Africa market was valued at USD 82.9 million in 2025. Saudi Arabia's dentist workforce rose 38% between 2019 and 2023, creating a foundation for new operatories and specialty capacity. The Gulf region's aesthetic and private-clinic demand can support higher-specification systems, particularly where providers compete on treatment experience and technology integration.
Across Africa, the opportunity is constrained by workforce scarcity even as oral-health need is substantial. The World Health Organization reported that approximately 42% of the African population experienced untreated oral diseases in 2021, while the region had only about 57,000 oral-health professionals in 2022. Portable, maintainable equipment can help extend access, but durable growth depends on training, service infrastructure, and the ability of clinics to sustain utilization after installation.
GMI Analyst View
Regional growth is being shaped by different operating models rather than by a single global adoption curve. North America and Europe lean toward replacement, network standardization, and digital-workflow compatibility. Asia Pacific combines the largest growth rate with the greatest diversity in affordability and infrastructure, making product-tier design and distribution capability decisive. Latin America links oral-health need with dental-tourism investment, while the Middle East and Africa pair selective premium demand with wider workforce and service constraints.
Dental Chair Market Share & Competitive Landscape
The five leading companies collectively accounted for approximately 28% of the dental chair market in 2025, while Dentsply Sirona held an estimated 12% share. This fragmentation leaves room for regional specialists and category-focused manufacturers, but the leading firms retain advantages in product breadth, dealer relationships, clinical training, and the ability to integrate chairside equipment into broader digital workflows.
Authorized market participants include:
Dentsply Sirona
Dentsply Sirona's competitive position rests on its ability to connect operatory equipment with imaging, scanning, and digital workflows. The company invested USD 165 million in research and development in 2024, with emphasis on cloud connectivity and digitally connected clinical workflows [7]Dentsply Sirona, dentsplysirona.com. For dental-chair buyers, the strategic value lies in avoiding isolated equipment decisions: a chair and delivery system can be positioned as part of a connected clinical ecosystem rather than as a stand-alone capital item.
A-dec
A-dec competes through durability, serviceability, and an operatories-first value proposition. The company provides a 10-year warranty on new dental chairs [8]A-dec, a-dec.com, an attribute that can reduce perceived lifecycle risk for practices weighing a premium purchase against lower-cost alternatives. Its Certified Pre-Owned Equipment program also broadens access to refurbished equipment and supports a secondary pathway for clinics seeking established systems with lower acquisition costs.
PLANMECA
Planmeca differentiates through a portfolio spanning dental units, imaging, CAD/CAM, and software. Its Planmeca Insights platform provides device-state, usage, and maintenance data, extending the competitive proposition from equipment supply toward operatory visibility and lifecycle management. This integrated approach is particularly relevant to multi-room clinics that seek to standardize workflows and anticipate maintenance needs rather than manage each device independently.
Recent Industry Developments
Need a specific section of this report?
Purchase regional analysis, country-level analysis, company profiles, or any other segment-level insights separately
based on your research needs.
Research methodology, data sources & validation process
This report draws on a structured research process built around direct industry conversations, proprietary modelling, and rigorous cross-validation and not just desk research.
Our 6-step research process
1. Research design & analyst oversight
At GMI, our research methodology is built on a foundation of human expertise, rigorous validation, and complete transparency. Every insight, trend analysis, and forecast in our reports is developed by experienced analysts who understand the nuances of your market.
Our approach integrates extensive primary research through direct engagement with industry participants and experts, complemented by comprehensive secondary research from verified global sources. We apply quantified impact analysis to deliver dependable forecasts, while maintaining complete traceability from original data sources to final insights.
2. Primary research
Primary research forms the backbone of our methodology, contributing nearly 80% to overall insights. It involves direct engagement with industry participants to ensure accuracy and depth in analysis. Our structured interview program covers regional and global markets, with inputs from C-suite executives, directors, and subject matter experts. These interactions provide strategic, operational, and technical perspectives, enabling well-rounded insights and reliable market forecasts.
3. Data mining & market analysis
Data mining is a key part of our research process, contributing nearly 20% to the overall methodology. It involves analysing market structure, identifying industry trends, and assessing macroeconomic factors through revenue share analysis of major players. Relevant data is collected from both paid and unpaid sources to build a reliable database. This information is then integrated to support primary research and market sizing, with validation from key stakeholders such as distributors, manufacturers, and associations.
4. Market sizing
Our market sizing is built on a bottom-up approach, starting with company revenue data gathered directly through primary interviews, alongside production volume figures from manufacturers and installation or deployment statistics. These inputs are then pieced together across regional markets to arrive at a global estimate that stays grounded in actual industry activity.
5. Forecast model & key assumptions
Every forecast includes explicit documentation of:
✓ Key growth drivers and their assumed impact
✓ Restraining factors and mitigation scenarios
✓ Regulatory assumptions and policy change risk
✓ Technology adoption curve parameter
✓ Macroeconomic assumptions (GDP growth, inflation, currency)
✓ Competitive dynamics and market entry/exit expectations
6. Validation & quality assurance
The final stages involve human validation, where domain experts manually review filtered data to identify nuances and contextual errors that automated systems might miss. This expert review adds a critical layer of quality assurance, ensuring data aligns with research objectives and domain-specific standards.
Our triple-layer validation process ensures maximum data reliability:
✓ Statistical Validation
✓ Expert Validation
✓ Market Reality Check
Trust & credibility
Verified data sources
Trade publications
Industry journals, trade publications, and specialized media.
Industry databases
Proprietary and third-party market databases
Regulatory filings
Government procurement records and policy documents
Academic research
University studies and specialist institution reports
Company reports
Annual reports, investor presentations, and filings
Expert interviews
C-suite, procurement leads, and technical specialists
GMI archive
13,000+ published studies across 20+ industry verticals
Trade data
Import/export volumes, HS codes, and customs records
Parameters studied & evaluated
Every data point in this report is validated through primary interviews, true bottom-up modelling, and rigorous cross-checks. Read about our research process →