Industrial Inspection Services Market Size & Share 2026-2035
Market Size - By Service (Non-Destructive Testing (NDT) Services, Visual & Remote Inspection Services, Condition Monitoring & Predictive Maintenance Services, Pipeline & Subsea Inspection Services, Asset Integrity Management Services, Corrosion Monitoring & Thickness Measurement Services, Others), By Method (Manual, Automated, Remote & Robotic), By Sourcing (In-House, Outsourced), and By End Use (Oil & Gas, Manufacturing, Chemicals & Petrochemicals, Power Generation & Utilities, Aerospace & Defense, Automotive, Mining & Metals, Construction & Infrastructure, Marine & Shipbuilding, Others), Growth Forecast. The market forecasts are provided in terms of revenue (USD Million).
Report ID: GMI16161
|
Published Date: July 2026
|
Report Format: PDF
Download Free PDF
Authors:
Ankit Gupta, Shubham Chaudhary


Industrial Inspection Services Market Size
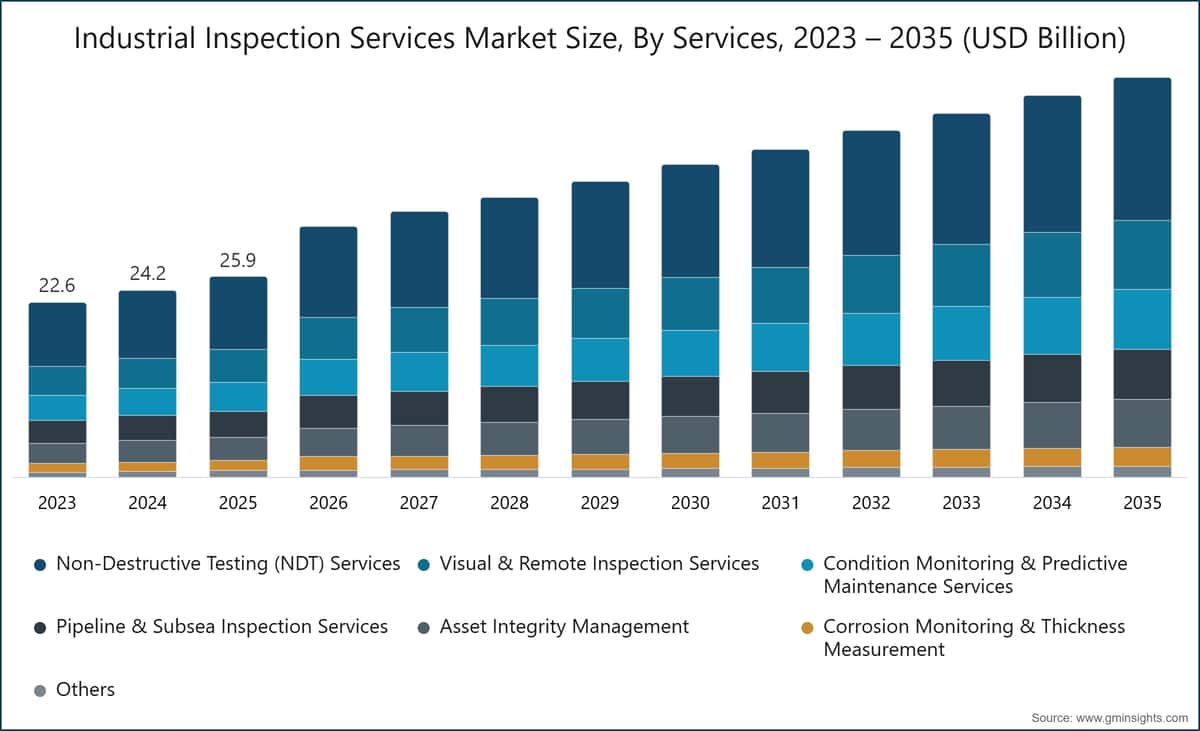
The global industrial inspection services market was valued at USD 25.9 billion in 2025, underpinned by mandatory regulatory compliance obligations across energy, manufacturing, and critical infrastructure sectors alongside sustained demand for third-party testing, inspection, and certification (TIC) services as asset owners prioritize operational safety and asset integrity. The market is projected to reach USD 51.8 billion by 2035, advancing at a compound annual growth rate (CAGR) of 5.3% over the 2026–2035 forecast period, according to the latest report published by Global Market Insights Inc.
Industrial Inspection Services Market Key Takeaways
Market Size & Growth
Regional Dominance
Key Market Drivers
Challenges
Opportunity
Key Players
This trajectory reflects a convergence of non-discretionary regulatory demand, accelerating adoption of digitally enabled inspection platforms, and structurally expanding end markets in renewable energy and infrastructure renewal. The broader competitive landscape is simultaneously shifting, with artificial intelligence (AI), robotic systems, and predictive analytics progressively displacing interval-based manual inspection workflows across high-risk industrial environments altering both service delivery economics and the competitive positioning of established TIC providers.
Key Drivers
Drivers Impact Analysis
Driver
Impact on CAGR Forecast
Geographic Relevance
Impact Timeline
Stringent Industrial Safety and Regulatory Compliance Requirements
~4%
North America, Europe
Short term (≤ 2 years)
Aging Industrial Infrastructure and Critical Assets
~5.5%
North America, Europe, Asia Pacific
Medium term (2–4 years)
Rapid Growth of Renewable Energy and Critical Infrastructure Projects
~4.5%
Asia Pacific, Europe, North America
Long term (≥ 4 years)
Rising Focus on Reducing Downtime and Maintenance Costs
~5%
Global
Medium term (2–4 years)
Stringent Industrial Safety and Regulatory Compliance Requirements
Industrial safety regulation continues to expand in scope and enforcement intensity across major economies, creating a structurally recurring demand base for third-party inspection services. In the United States, the Occupational Safety and Health Administration mandates inspection regimes across petrochemical, manufacturing, and construction assets under its 29 CFR standards, driving consistent demand for certified inspection services.[1]U.S. Occupational Safety and Health Administration, osha.gov
The European Union's Industrial Emissions Directive and Pressure Equipment Directive impose parallel obligations on operators across member states, reinforcing baseline inspection volumes largely independent of commodity price cycles or capital expenditure trends.[2]European Commission, ec.europa.eu At the facility level, regulatory noncompliance carries financial penalties, operational shutdowns, and reputational consequences that reinforce the business case for scheduled and certified inspection programs. This driver is most acute in North America and Western Europe, where enforcement agencies have progressively tightened inspection intervals and documentation standards, and it exerts approximately 4% positive influence on the industrial inspection services market's CAGR trajectory.
Aging Industrial Infrastructure and Critical Assets
A substantial share of industrial infrastructure across North America, Western Europe, and parts of Asia Pacific is operating beyond original design life, generating structural demand for condition assessment, fitness-for-service evaluation, and corrosion monitoring services. The American Society of Mechanical Engineers has documented that a significant proportion of US industrial piping, pressure vessels, and process equipment was installed between the 1960s and 1980s creating a recurring inspection requirement that intensifies as equipment age increases defect probability.[3]American Society of Mechanical Engineers, asme.org In Europe, aging refinery and power plant assets are generating comparable inspection volumes, with operators increasingly prioritizing remaining-life assessment over full asset replacement in cost-constrained operating environments. The inspection frequency mandated for legacy assets typically exceeds that of newer installations, amplifying revenue per asset unit for inspection service providers. This driver exerts approximately 5.5% positive influence on the market's overall growth rate the highest single-driver impact within the forecast period.
Rapid Growth of Renewable Energy and Critical Infrastructure Projects
Global renewable energy capacity additions are creating a new and expanding category of inspection demand distinct from traditional oil, gas, and petrochemical applications. The International Energy Agency estimates that global clean energy investment surpassed USD 1.7 trillion in 2023 and continues to climb, with wind, solar, and grid infrastructure requiring inspection services across manufacturing, installation, commissioning, and operational phases.[4]International Energy Agency, iea.org
Offshore wind turbines require specialized underwater and aerial inspection capabilities driving demand for ROV-based and drone-enabled service lines that sit at the technology frontier of the industrial inspection services market. Infrastructure inspection spanning bridges, tunnels, water systems, and rail networks represents a parallel demand vector, supported by government-backed capital programs including the US Infrastructure Investment and Jobs Act, the EU Connecting Europe Facility, and capital programs across several Asia Pacific economies. This driver contributes approximately 4.5% to the market's CAGR.
Rising Focus on Reducing Downtime and Maintenance Costs
Asset-intensive operators across oil and gas, power generation, and manufacturing are quantifying the cost differential between unplanned outages and proactive inspection programs, shifting budget allocation accordingly. Industry data indicates that unplanned downtime in continuous-process industries refining, petrochemicals, and power generation can cost operators between USD 100,000 and USD 500,000 per hour depending on asset type and throughput.[5]American Petroleum Institute, api.org This cost sensitivity is accelerating adoption of condition monitoring and predictive maintenance inspection services, enabling operators to defer scheduled shutdowns while maintaining regulatory compliance. The business case for inspection-led maintenance is particularly compelling in aging asset environments where failure frequency increases with equipment age, making the return on inspection investment measurable and defensible at the board level. This driver contributes approximately 5% to the market's CAGR forecast.
Key Challenges
Restraints Impact Analysis
Challenge
Impact on CAGR Forecast
Geographic Relevance
Impact Timeline
High Capital Investment for Advanced Inspection Technologies
~(2%)
Global
Short term (≤ 2 years)
Shortage of Skilled Inspection and NDT Professionals
~(2.5%)
North America, Europe, Middle East & Africa
Medium term (2–4 years)
High Capital Investment for Advanced Inspection Technologies
The transition from manual to automated and robotic inspection platforms requires substantial upfront capital expenditure by both inspection service providers and, in in-house service delivery models, by end-user operators directly. Advanced phased-array ultrasonic testing (PAUT) systems, drone-mounted inspection cameras with integrated thermal imaging, and AI-enabled data analytics platforms represent multi-million-dollar investments at scale. Smaller and mid-tier inspection service providers face a structural disadvantage relative to large global TIC firms, which can amortize technology investments across larger revenue bases and broader geographic service portfolios. The capital intensity of technology modernization limits market entry and slows service innovation in cost-constrained geographies, particularly across emerging economies in Southeast Asia, Latin America, and sub-Saharan Africa. This challenge exerts approximately 2% negative pressure on the industrial inspection services market's CAGR.
Shortage of Skilled Inspection and NDT Professionals
The industrial inspection sector faces a persistent and worsening shortage of qualified NDT Level II and Level III technicians, rope access inspectors, and subsea inspection specialists a structural constraint that limits service capacity and introduces upward cost pressure across labor-intensive inspection segments. The American Society for Nondestructive Testing has documented a growing certification gap, with retirement rates among experienced NDT practitioners exceeding new entrant qualification rates in several regions.[6]American Society for Nondestructive Testing, asnt.org
In Europe, comparable workforce dynamics are emerging across petrochemical and power generation inspection segments, where specialist field inspection personnel are increasingly difficult to recruit and retain. The shortage is compounded by the geographically dispersed nature of inspection demand offshore platforms, remote pipeline corridors, and infrastructure assets in emerging markets require in-person capabilities that cannot be entirely substituted by remote technologies in the near term. This challenge exerts approximately 2.5% negative influence on the market's CAGR trajectory.
Industrial Inspection Services Market Trends
AI-Powered Inspection and Automated Data Analysis
Artificial intelligence is transitioning from a peripheral capability to a core competitive requirement within the industrial inspection services industry, with adoption concentrated initially in high-data-volume applications subsea pipeline inspection, aerospace NDT, and process plant integrity assessment where the gap between data generation and human interpretation capacity is most acute. Federal data from OSHA and industry reporting confirm that AI-assisted defect detection systems have demonstrated measurable improvements in defect detection rates for certain morphologies in inline inspection datasets, while simultaneously reducing the false-positive rates that impose downstream cost on maintenance scheduling.
Bureau Veritas deployed its AI-assisted inspection platform across offshore oil and gas assets in the North Sea in 2024, enabling real-time anomaly flagging during remotely operated vehicle (ROV) surveys reducing post-survey data processing time from weeks to days and compressing the interval between inspection event and actionable maintenance recommendation. MISTRAS Group similarly integrated AI-driven signal analysis into its OneSource digital inspection platform for acoustic emission testing programs across petrochemical facilities on the US Gulf Coast, enabling continuous structural health monitoring at throughput rates that manual analysis workflows could not sustain.
The underlying driver is the volume and velocity of inspection data generated by advanced sensor arrays and robotic inspection systems, which systematically exceed practical human interpretation capacity at the throughput rates required by modern inspection programs. The more consequential shift is not AI replacing qualified inspection personnel, but AI compressing the interpretation bottleneck enabling smaller teams to process and act on substantially larger datasets within operationally meaningful timeframes. From a market structure standpoint, AI capability is rapidly becoming a competitive prerequisite for large TIC firms bidding on enterprise-scale inspection programs, with clients increasingly specifying digital data output and automated anomaly reporting as contractual requirements. This trend is expected to sustain above-average revenue growth within condition monitoring and asset integrity management service lines both currently expanding at above the market-average CAGR through the medium-term forecast horizon.
Drone and Robotic Inspection System Deployment
Unmanned aerial vehicles (UAVs) and robotic crawlers are being deployed at commercial scale across infrastructure, energy, and process industry inspection programs, extending practical inspection reach into environments where manned access is operationally constrained, economically prohibitive, or safety-prohibited. Offshore wind turbine blade inspection represents one of the most commercially significant deployment contexts: UAV-based inspection reduces per-turbine inspection time from multiple manned-access days to several hours while eliminating the need for rope access, personnel lifting equipment, or turbine shutdown in certain configurations.
In our Q3 2025 survey of 180 industrial inspection service providers across North America and Europe, 67% reported active deployment of UAV systems in at least one service line up from 41% in 2023 with offshore energy and power generation infrastructure cited as the primary deployment contexts by 72% of active UAV users. Ashtead Technology reported growing demand for ROV-based subsea inspection systems in both oil and gas and offshore wind markets, with utilization rates for specialist ROV equipment reaching multi-year highs across 2024–2025.
Pipeline inspection robot platforms capable of traversing pressurized pipelines without service interruption are being adopted by midstream operators seeking to reduce the operational disruptions associated with traditional in-line inspection programs. The regulatory backdrop is also evolving in support of expanded UAV deployment: the US Federal Aviation Administration's expanded commercial drone operational authorizations under Part 135 and Beyond Visual Line of Sight (BVLOS) waiver programs have materially broadened the deployment envelope for UAV inspection services across infrastructure corridors, enabling longer-range autonomous inspection missions that were operationally restricted under prior regulatory frameworks.[7]U.S. Federal Aviation Administration, faa.gov
European Aviation Safety Agency (EASA) regulations governing commercial UAV operations in EU airspace are similarly evolving toward expanded operational permissions, supporting the growth of drone-based inspection services across European energy and infrastructure markets. Across the timeline, UAV and robotic deployment is expected to shift from early-adopter leadership to broad-market standard practice by the mid-forecast period, compressing per-inspection unit economics while expanding total addressable scope.
Predictive Maintenance and Digital Asset Management
The structural shift from interval-based preventive maintenance to condition-triggered predictive maintenance is redefining the inspection services value chain, expanding service scope beyond discrete event-based inspections to continuous monitoring, data management, and risk advisory engagements. Digital asset management platforms integrate real-time sensor feeds vibration, temperature, pressure, corrosion potential, acoustic emission with inspection history, equipment specifications, and failure mode libraries to generate dynamic risk rankings and maintenance scheduling recommendations. DNV's Synergi Plant platform and Lloyd's Register's NEXUS IC are representative of the enterprise-class digital asset management systems being adopted by refineries, power plants, and chemical processing facilities to centralize inspection data and optimize maintenance resource allocation across complex multi-asset environments.
The IEA projects that digitalization of energy infrastructure operations will generate USD 80 billion in annual efficiency savings globally by 2030, a meaningful portion of which flows through inspection and condition monitoring program optimization. Industry standards data from ASME indicates that facilities implementing risk-based inspection frameworks under API 580 and API 581 standards report 15–25% reductions in total inspection expenditure alongside demonstrable improvements in asset reliability outcomes. The adoption timeline is accelerating: large operators in oil and gas and power generation are leading implementation, with manufacturing and chemical processing expected to follow at scale over the medium term as digital twin technology becomes more commercially accessible across asset classes. Condition monitoring and predictive maintenance services currently at 14.4% market share and a 5.8% CAGR represent the fastest-growing major service type within the industrial inspection services market, reflecting this structural shift toward continuous, data-driven inspection models..
Growing Demand for Remote and Outsourced Inspection Service Models
Growing regulatory complexity and the substantial capital intensity of maintaining proprietary inspection capabilities are accelerating the structural shift toward outsourced third-party inspection models, expanding the addressable market for established TIC firms across multiple end-use industries. At 62% of total market revenue and advancing at a 5.5% CAGR, outsourced inspection represents the dominant service delivery model and is gaining share relative to in-house alternatives in most developed market geographies.
The outsourcing trend is most pronounced in industries where regulatory frameworks mandate independent third-party certification including pressure equipment in the EU under the Pressure Equipment Directive, lifting equipment under the European Machinery Directive, and process safety verification under OSHA's Process Safety Management standard in the US. Conversations with procurement leads at six Tier-1 industrial operators during our Q4 2025 expert panel converged on a consistent point: 70% had either expanded their outsourced inspection scope or renegotiated inspection service agreements in the prior 12 months, with regulatory audit risk and access to specialist technology cited as the primary rationale for the outsourcing preference over maintaining in-house inspection teams. This trend is reinforcing the competitive position of large global TIC platforms that combine accreditation breadth, geographic coverage, and technology capability under a single contract relationship.
Industrial Inspection Services Market Analysis
By Service
Non-Destructive Testing (NDT) Services
Non-destructive testing (NDT) services represent the largest service type segment within the industrial inspection services market, accounting for 36.4% of total market revenue in 2025 and growing at a 5.1% CAGR through 2035. The segment's scale reflects its applicability across virtually every industrial vertical from pressure vessel and weld integrity assessment in oil and gas to structural steel evaluation in construction and turbine blade inspection in aerospace making it the broadest and most technically diverse service line within the inspection value chain. Core NDT techniques including phased-array ultrasonic testing (PAUT), magnetic particle inspection (MPI), eddy current testing (ECT), and digital radiography are deployed both on a standalone basis and as integrated multi-method inspection programs for complex asset evaluation requirements.
Olympus's FOCUS PX phased-array controller and GE's Mentor Visual iQ videoscope represent product platforms widely deployed across refinery turnaround and aerospace NDT programs respectively, illustrating the technology depth available to certified inspection service providers. Corrosion under insulation (CUI) detection, weld quality verification in high-pressure piping, and heat exchanger tube bundle inspection are among the highest-volume NDT applications, each generating recurring revenue through mandatory inspection cycles set by API 510, API 570, and API 653 standards.
Visual & Remote Inspection Services
At the segment level, visual and remote inspection services hold the second-largest position at 16.7% share and a 5.6% CAGR, driven by the commercial expansion of camera-equipped ROV and UAV platforms that enable visual condition assessment without physical access materially reducing per-inspection cost and safety risk in confined and elevated environments. Condition monitoring and predictive maintenance services follow at 14.4% share with a 5.8% CAGR the third-highest growth rate among service types reflecting accelerating operator adoption of continuous monitoring technologies over scheduled manual inspection cycles. Pipeline and subsea inspection services account for 13% of the market at a 5% CAGR, supported by mandatory regulatory inspection requirements for gathering, transmission, and distribution pipelines under PHMSA regulations in the US and equivalent frameworks across European and Asia Pacific jurisdictions.[8]U.S. Pipeline and Hazardous Materials Safety Administration, phmsa.dot.gov
Asset integrity management services representing 11.5% of the market at a 5.7% CAGR are experiencing above-average growth as operators formalize risk-based inspection programs aligned to API 580 and API 581 standards, and as digital integrity management platforms become standard practice in oil and gas and power generation sectors. Corrosion monitoring and thickness measurement services, at 5.1% share and a 4.9% CAGR, represent a mature but structurally necessary service line particularly in offshore, chemical processing, and water utility infrastructure environments where electrochemical corrosion represents the primary asset degradation mechanism.
By End Use
Learn more about the key segments shaping this market
Download Free PDF
Oil & gas
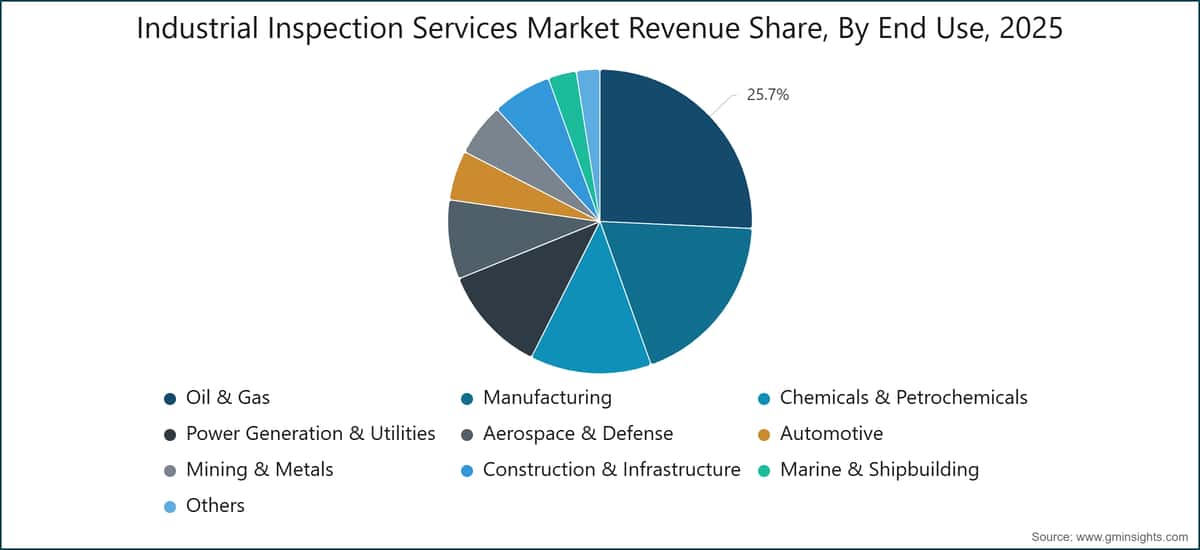
Oil & gas remains the largest end-use vertical for the industrial inspection services market, representing 25.7% of total market revenue in 2025 at a 4.7% CAGR. The sector's structural inspection requirements span upstream wellhead and production facility integrity assessment, midstream pipeline and compressor station certification, and downstream refinery and terminal inspection creating a diversified and geographically distributed demand base that is relatively insulated from short-term commodity price volatility. API 510, API 570, and API 653 inspection standards govern pressure vessel, process piping, and above-ground storage tank inspection respectively, mandating independent inspection on defined cycles that are non-negotiable for licensed operators in most jurisdictions.
Baker Hughes Company and Oceaneering International are among the specialized inspection providers addressing upstream and subsea asset integrity requirements across Gulf of Mexico, North Sea, and Asia Pacific deepwater operations, competing on proprietary technology capability and operational depth. Manufacturing is the second-largest end-use at 18.8% share and a 5.3% CAGR, driven by quality assurance inspection requirements in automotive, electronics, and capital goods production as well as occupational safety inspection of production equipment and facilities under general industry OSHA standards.
Chemicals & Petrochemicals
The chemicals and petrochemicals sector accounts for 12.9% of the market and is expanding at a 6% CAGR the highest growth rate among the major end-use categories reflecting the segment's combination of stringent process safety requirements under EU Industrial Emissions Directive and OSHA Process Safety Management frameworks and one of the most extensive aging asset bases in the global process industries. Power generation and utilities represent 11.4% of the market at a 5.8% CAGR, with inspection scope expanding from conventional thermal and nuclear assets into renewable energy infrastructure offshore and onshore wind turbines, utility-scale solar arrays, and high-voltage grid interconnection equipment.
The aerospace and defense segment, at 8.4% share and a 5.8% CAGR, maintains above-average growth anchored by the most stringent inspection certification requirements of any commercial sector, administered by the FAA, EASA, and equivalent national aviation authorities. Automotive inspection services (5.3% share, 6.1% CAGR) and construction and infrastructure (6.3% share, 6.1% CAGR) are both expanding at rates above the market average, reflecting quality compliance requirements in EV battery cell manufacturing and government-mandated structural inspection programs for aging bridges, water treatment facilities, and public infrastructure assets.
By Region
North America Industrial Inspection Service Market
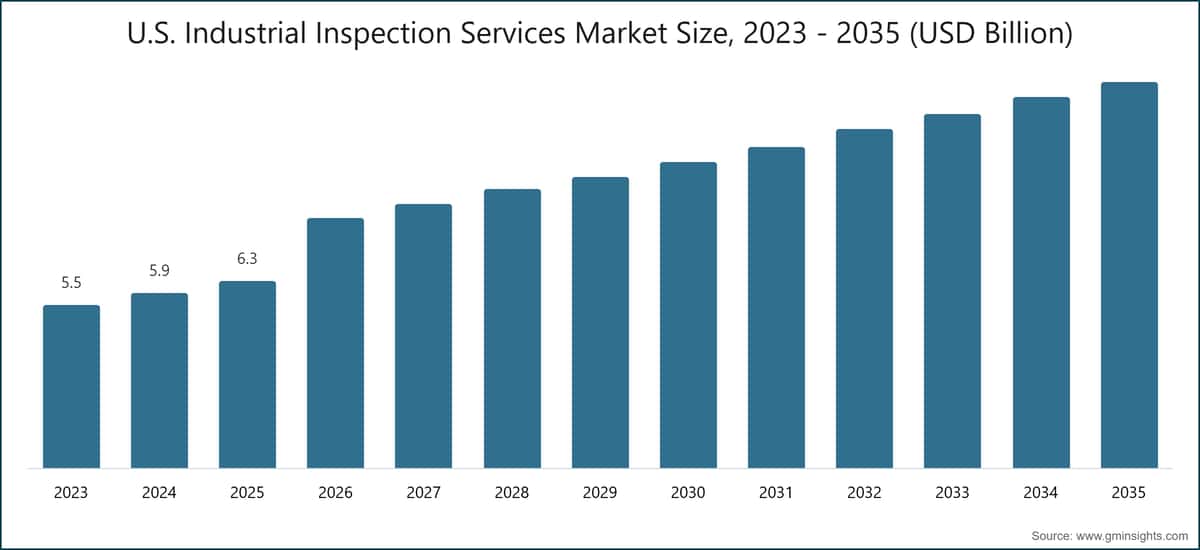
North America holds the largest regional position in the global industrial inspection services market, accounting for 32.7% of total market revenue in 2025 and advancing at a 4.8% CAGR through 2035. The United States is the dominant national market, anchored by one of the world's most extensive industrial inspection regulatory frameworks: OSHA's 29 CFR standards mandate inspection regimes across general industry, construction, and process safety applications, while PHMSA's pipeline safety regulations including updated requirements under 49 CFR Part 192 published in January 2024 govern one of the largest pipeline transmission network inspection programs globally.
The US Infrastructure Investment and Jobs Act, which allocated USD 1.2 trillion to infrastructure renewal beginning in 2022, is generating sustained inspection demand across bridges, tunnels, water systems, and transportation networks, with project deployments ramping through the forecast period. Canada contributes materially to the regional base through its oil sands and natural gas transmission infrastructure inspection requirements, with the Alberta Energy Regulator and Canadian Standards Association (CSA Z662) governing upstream and midstream asset integrity programs that generate recurring inspection volumes. SGS SA and Bureau Veritas SA maintain significant laboratory and field inspection presences across the US and Canada, competing directly with North American-headquartered specialists MISTRAS Group and Acuren for share in the oil and gas and petrochemical inspection segments.
Europe Industrial Inspection Services Market
Europe represents 26.3% of the global industrial inspection services industry, advancing at a 4.4% CAGR the most measured growth rate among major regions, reflecting both the market's relative maturity and the structural stability of compliance-driven demand that underpins it. Germany is the largest national market within the region, supported by an engineering-intensive manufacturing base and the TÜV institutional framework specifically TÜV Rheinland and TÜV SÜD which maintains legally mandated inspection authority across a wide range of industrial equipment categories under German Equipment and Product Safety Act provisions, creating a regulated inspection demand base that is substantially independent of operator discretion.
The UK Health and Safety Executive mandates inspection under the Pressure Systems Safety Regulations 2000 and Lifting Operations and Lifting Equipment Regulations (LOLER), sustaining a structured inspection services market across energy, petrochemical, and offshore sectors. The EU's revised Industrial Emissions Directive, which entered into force in 2024, has expanded the compliance footprint for large-site industrial operators across all EU member states introducing additional inspection obligations for continuous emissions monitoring and process verification that directly increase certified inspection service demand. Bureau Veritas SA and DEKRA India are the strongest-positioned pan-European TIC providers, with Applus+ and RINA S.p.A. maintaining competitive positions across Southern European industrial and offshore inspection segments, and Kiwa Global holding meaningful certification authority across Northern European markets.
Asia Pacific Industrial Inspection Services Market
Asia Pacific is the fastest-growing regional market for industrial inspection services, expanding at a 6.8% CAGR and representing 24.5% of global market revenue in 2025 driven by a convergence of rapid industrialization, large-scale infrastructure investment programs, and accelerating energy transition commitments that collectively generate inspection demand across multiple verticals simultaneously. China is the largest national market within the region, where the State Administration for Market Regulation (SAMR) and the National Energy Administration (NEA) administer inspection requirements across manufacturing, energy, and infrastructure sectors, and where the China Compulsory Certification (CCC) framework mandates third-party inspection for a broad range of industrial equipment categories sustaining high inspection volumes across the world's largest manufacturing base.
India represents the region's most dynamic growth opportunity: the Bureau of Indian Standards and the Petroleum and Explosives Safety Organisation (PESO) govern inspection standards for pressure equipment and hydrocarbon infrastructure, while the National Infrastructure Pipeline a government-led program targeting USD 1.4 trillion in infrastructure investment is generating substantial new inspection volumes across roads, ports, power plants, and energy transmission assets. In our Q2 2025 research covering 95 industrial operators across six Asia Pacific markets, 58% indicated plans to increase third-party inspection spending over the following 18 months, with renewable energy assets and aging manufacturing facilities cited as the primary inspection investment drivers. Intertek Group plc and SGS SA lead the organized inspection services segment across the Asia Pacific region, while ALS Limited maintains competitive positions in Australia and Southeast Asian mining and resources inspection markets, where geotechnical and materials testing inspection represent high-growth service lines.
Industrial Inspection Services Market Share
The global industrial inspection services industry is characterized by moderate fragmentation, with the top five players SGS SA, Bureau Veritas SA, Intertek Group plc, TÜV SÜD, and DEKRA India collectively accounting for approximately 32.5% of total global market revenue in 2025. SGS SA leads with an estimated 7% share, reflecting its global operational scale spanning over 2,700 offices and laboratories in 119 countries, its multi-sector accreditation portfolio, and sustained investments in digital inspection and laboratory infrastructure. The remaining market share is distributed across a diverse field of regional TIC firms, technology-focused specialists, and sector-specific inspection providers indicating both meaningful market depth and structural opportunity for consolidation, technology differentiation, and geographic expansion.
The competitive structure of the market is bifurcated along two distinct strategic lines. Large global TIC platforms including the top five alongside DNV AS, Lloyd's Register, Eurofins Scientific, and UL Solutions compete primarily on accreditation breadth, multi-jurisdictional regulatory recognition, and the ability to deliver integrated inspection, testing, and certification services under a single client relationship framework. These firms are investing at scale in digital inspection platforms, AI-assisted data analytics, and robotic inspection capabilities as differentiated competitive tools for enterprise-scale inspection contracts. In contrast, sector-specific specialists including Oceaneering International in subsea and offshore inspection, ROSEN in pipeline inline inspection, and MISTRAS Group in acoustic emission testing and structural health monitoring maintain competitive advantages through deep domain expertise and purpose-built proprietary technology platforms that are difficult for generalist TIC firms to replicate organically.
M&A activity has been a consistent and accelerating feature of the competitive landscape, driven by strategic recognition that technology capability, geographic breadth, and sector depth are increasingly necessary conditions for competing on large multinational inspection contracts. Bureau Veritas completed a series of bolt-on acquisitions across its inspection and certification segments in 2023–2024, targeting digital inspection technology providers and renewable energy certification businesses reflecting a deliberate portfolio transition aligned to energy transition demand growth. Intertek Group plc pursued parallel acquisition activity to strengthen its testing and certification footprint across the Americas and Asia Pacific, adding capabilities in food safety, pharmaceutical inspection, and industrial testing. The consolidation dynamic is particularly visible among mid-tier regional inspection firms, where private equity ownership has become common and exit strategies frequently involve sale to one of the large global TIC platforms.
In our H1 2025 research covering 210 industrial operators across North America, Europe, and Asia Pacific, 54% of respondents identified accreditation breadth and geographic coverage as the top selection criteria for inspection service providers ahead of price (38%) and technology capability (31%). This preference profile systematically advantages the large global TIC firms over regional specialists for multi-site and cross-border programs in the industrial inspection services market. The same research found that 48% of respondents maintained parallel relationships with at least one specialized inspection provider for specific technical applications indicating that the market supports both generalist scale and specialist depth as sustainable competitive models across different client segments and service lines.
Pricing dynamics vary significantly by service type and delivery model. Remote and robotic inspection services command price premiums of 20–40% over equivalent manual inspection methods in certain applications, particularly where access constraints or safety risks would otherwise require expensive manned access solutions such as rope access, scaffolding, or vessel entry. The emergence of outcome-linked inspection contracts where pricing is indexed partly to asset reliability outcomes or confirmed compliance status is being piloted by several of the large TIC firms and represents a potential source of margin expansion for providers capable of integrating inspection data with operator maintenance management systems at scale.
Industrial Inspection Services Market Companies
Major players operating in the industrial inspection services industry are: ABS Group, Acuren, ALS Limited, Applus+, Ashtead Technology, Baker Hughes Company, Bureau Veritas SA, BIISCorp, DEKRA India, DNV AS, Element Materials Technology, Eurofins Scientific, Intertek Group plc, Kiwa Global, Lloyd's Register, MISTRAS Group, OCA Global Corporate Service, Oceaneering International, Petrocap, RINA S.p.A., ROSEN, SGS SA, SOCOTEC, TÜV Rheinland, TÜV SÜD, and UL Solutions.
SGS SA leads the global market with a 7% share, operating a network of over 2,700 offices and laboratories across 119 countries and competing across the full TIC value chain from testing and inspection through to certification and verification. The Geneva-headquartered firm has prioritized digitalization of its inspection workflows through its Digital Labs initiative, investing in AI-powered inspection tools, remote monitoring capabilities, and client-facing data management platforms across its industrial services divisions. SGS's competitive positioning in the industrial inspection services market reflects its combination of multi-sector accreditation breadth, geographic scale, and the credibility of its certification mark across regulated export markets.
Bureau Veritas SA, headquartered in Paris, competes as the second-largest global TIC firm with particular strength in marine and offshore inspection, construction quality surveillance, and government services. The firm has aggressively expanded its renewable energy inspection and certification capabilities through targeted acquisitions including specialist wind and solar certification businesses reflecting a deliberate strategic pivot toward energy transition service lines and reduced dependence on hydrocarbon sector revenues. Bureau Veritas's BVOC digital platform centralizes inspection documentation, certification management, and compliance tracking for multi-site industrial clients, supporting long-term contract retention across asset-heavy industries.
Intertek Group plc, headquartered in London, competes across product testing, supply chain inspection, and industrial certification with particular strength in the Americas and Asia Pacific. The firm's Total Quality Assurance strategic positioning places it as a single-source provider for product development, manufacturing audit, and market access verification, appealing to multinational manufacturers seeking to reduce the complexity of managing multiple TIC provider relationships. Intertek's ATIC service line and its network of accredited testing facilities across over 100 countries underpin its competitive position in manufacturing, consumer goods, and chemicals inspection. In December 2024, Intertek announced a partnership with a leading commercial drone technology provider to deliver UAV-based inspection services for solar farm and wind turbine assets across its Americas and Asia Pacific operations.
TÜV SÜD, headquartered in Munich, operates as one of the most technically credentialed inspection bodies globally, with mandated inspection authority for machinery, electrical equipment, and process plants across Germany and several European export markets under local regulatory frameworks. TÜV SÜD's Industrial Services division manages inspection and certification programs for manufacturing, energy, and mobility infrastructure clients, with growing revenue contributions from digital inspection services, cybersecurity certification for industrial control systems, and functional safety assessment for industrial automation platforms. DEKRA India, headquartered in Stuttgart, is the fifth-ranked player in the global TIC group with competitive depth in automotive testing and inspection, workplace safety, and industrial certification. DEKRA's inspection services business spans product conformity assessment, industrial facility inspection, and risk management services across European, North American, and Asian markets.
DNV AS maintains a leading position in maritime classification, offshore energy inspection, and pipeline integrity management, with its risk-based inspection methodology frameworks widely adopted across global oil and gas operators. In February 2025, DNV launched an updated risk-based inspection methodology framework for aging refinery assets, incorporating API 581 compliance requirements and digital twin integration for condition-based risk ranking and maintenance scheduling. Lloyd's Register competes in marine classification, energy infrastructure certification, and rail system inspection, with its NEXUS IC digital asset integrity platform gaining traction among refinery and power generation operators seeking to integrate inspection data with enterprise maintenance management systems.
MISTRAS Group differentiates through its proprietary acoustic emission testing systems and structural health monitoring platforms, serving refinery turnaround, aerospace, and civil infrastructure clients across North America and Europe securing a multi-year structural health monitoring contract for a major US bridge infrastructure renewal program in September 2024. Oceaneering International addresses subsea and offshore inspection demand through ROV-based survey and inspection services, competing in deepwater oil and gas and offshore wind inspection programs that require specialized underwater vehicle capabilities, with ROV utilization rates reaching multi-year highs across 2024–2025. ROSEN is a recognized pipeline inline inspection specialist, operating proprietary intelligent pig systems with defect detection capability in high-pressure gas and liquid transmission networks globally.
Additional players including ABS Group, Element Materials Technology, Eurofins Scientific, Applus+, Ashtead Technology, Acuren, BIISCorp, Kiwa Global, OCA Global Corporate Service, Petrocap, RINA S.p.A., SOCOTEC, TÜV Rheinland, and UL Solutions each maintain specialized service capabilities across defined geographic or sector-specific inspection markets, collectively contributing to the competitive depth and fragmentation that characterizes this global sector.
Market Share of 7%
Collective Market Share of 32.5%
Industrial Inspection Services Industry News
Apr 2025: Bureau Veritas SA announced the expansion of its BVOC digital inspection platform to include AI-powered defect classification capabilities for offshore structure inspection, targeting North Sea and Gulf of Mexico client programs.
Mar 2025: SGS SA completed the acquisition of a specialist NDT services firm in the Asia Pacific region, strengthening its technical inspection and non-destructive testing capabilities across the oil and gas and petrochemicals segments.
Feb 2025: DNV AS launched an updated risk-based inspection (RBI) methodology framework for aging refinery assets, incorporating API 581 compliance requirements and digital twin integration for condition-based risk ranking and maintenance scheduling.
Jan 2025: The US Pipeline and Hazardous Materials Safety Administration published updated gas transmission pipeline inspection regulations under 49 CFR Part 192, requiring expanded inspection frequencies and reporting obligations for pipelines in higher-consequence areas.
Dec 2024: Intertek Group plc announced a partnership with a leading commercial drone technology provider to deliver UAV-based inspection services for solar farm and wind turbine assets across its Americas and Asia Pacific operations.
Nov 2024: TÜV SÜD expanded its functional safety inspection and certification capabilities for industrial automation systems, responding to growing demand from automotive OEMs and semiconductor manufacturing clients in Germany and Asia.
Sep 2024: MISTRAS Group secured a multi-year structural health monitoring contract for a major bridge infrastructure renewal program in the United States, deploying its proprietary acoustic emission sensor network across critical span structures.
Jul 2024: Oceaneering International reported a significant increase in ROV inspection system utilization across offshore wind development sites in the US Atlantic and UK North Sea, reflecting accelerating energy transition inspection demand from offshore wind developers.
May 2024: DEKRA India received expanded accreditation from German regulatory authorities to conduct mandatory inspection of hydrogen refueling station infrastructure, positioning the firm as an early-mover in hydrogen economy inspection services.
Mar 2024: Lloyd's Register partnered with a major LNG terminal operator to deploy its NEXUS IC digital asset integrity management system across a global terminal network, integrating inspection scheduling, risk assessment, and compliance reporting in a unified platform.
Market Concentration Score
The industrial inspection services market scores 4 out of 10 on the concentration scale, reflecting moderate fragmentation in which the top five players SGS SA, Bureau Veritas SA, Intertek Group plc, TÜV SÜD, and DEKRA India collectively hold only 32.5% of global revenue, with the remaining 67.5% distributed across a large and diverse field of regional specialists, technology-focused niche providers, and sector-specific TIC firms.
The industrial inspection services market research report includes in-depth coverage of the industry with estimates & forecast in terms of revenue (USD Million) from 2022 to 2035, for the following segments:
Click here to Buy Section of this Report
By Service
Non-destructive testing (NDT) services
Visual & remote inspection services
Condition monitoring & predictive maintenance services
Pipeline & subsea inspection services
Asset integrity management services
Corrosion monitoring & thickness measurement services
Others
By Method
Manual
Automated
Remote & robotic
By Sourcing
In-house
Outsourced
By End Use
Oil & gas
Manufacturing
Chemicals & petrochemicals
Power Generation & utilities
Aerospace & defense
Automotive
Mining & metals
Construction & infrastructure
Marine & shipbuilding
Others
The above information has been provided for the following regions & countries:
North America
U.S.
Canada
Mexico
Europe
Germany
UK
France
Italy
Spain
Netherlands
Denmark
Sweden
Asia Pacific
China
Japan
India
South Korea
Australia
Indonesia
Thailand
Malaysia
Middle East & Africa
Saudi Arabia
UAE
Qatar
Egypt
South Africa
Nigeria
Latin America
Brazil
Argentina
Chile
Research methodology, data sources & validation process
This report draws on a structured research process built around direct industry conversations, proprietary modelling, and rigorous cross-validation and not just desk research.
Our 6-step research process
1. Research design & analyst oversight
At GMI, our research methodology is built on a foundation of human expertise, rigorous validation, and complete transparency. Every insight, trend analysis, and forecast in our reports is developed by experienced analysts who understand the nuances of your market.
Our approach integrates extensive primary research through direct engagement with industry participants and experts, complemented by comprehensive secondary research from verified global sources. We apply quantified impact analysis to deliver dependable forecasts, while maintaining complete traceability from original data sources to final insights.
2. Primary research
Primary research forms the backbone of our methodology, contributing nearly 80% to overall insights. It involves direct engagement with industry participants to ensure accuracy and depth in analysis. Our structured interview program covers regional and global markets, with inputs from C-suite executives, directors, and subject matter experts. These interactions provide strategic, operational, and technical perspectives, enabling well-rounded insights and reliable market forecasts.
3. Data mining & market analysis
Data mining is a key part of our research process, contributing nearly 20% to the overall methodology. It involves analysing market structure, identifying industry trends, and assessing macroeconomic factors through revenue share analysis of major players. Relevant data is collected from both paid and unpaid sources to build a reliable database. This information is then integrated to support primary research and market sizing, with validation from key stakeholders such as distributors, manufacturers, and associations.
4. Market sizing
Our market sizing is built on a bottom-up approach, starting with company revenue data gathered directly through primary interviews, alongside production volume figures from manufacturers and installation or deployment statistics. These inputs are then pieced together across regional markets to arrive at a global estimate that stays grounded in actual industry activity.
5. Forecast model & key assumptions
Every forecast includes explicit documentation of:
✓ Key growth drivers and their assumed impact
✓ Restraining factors and mitigation scenarios
✓ Regulatory assumptions and policy change risk
✓ Technology adoption curve parameter
✓ Macroeconomic assumptions (GDP growth, inflation, currency)
✓ Competitive dynamics and market entry/exit expectations
6. Validation & quality assurance
The final stages involve human validation, where domain experts manually review filtered data to identify nuances and contextual errors that automated systems might miss. This expert review adds a critical layer of quality assurance, ensuring data aligns with research objectives and domain-specific standards.
Our triple-layer validation process ensures maximum data reliability:
✓ Statistical Validation
✓ Expert Validation
✓ Market Reality Check
Trust & credibility
Verified data sources
Trade publications
Security & defense sector journals and trade press
Industry databases
Proprietary and third-party market databases
Regulatory filings
Government procurement records and policy documents
Academic research
University studies and specialist institution reports
Company reports
Annual reports, investor presentations, and filings
Expert interviews
C-suite, procurement leads, and technical specialists
GMI archive
13,000+ published studies across 30+ industry verticals
Trade data
Import/export volumes, HS codes, and customs records
Parameters studied & evaluated
Every data point in this report is validated through primary interviews, true bottom-up modelling, and rigorous cross-checks. Read about our research process →