
Positive Displacement Blowers Market Size & Share 2026-2035
Download Free PDF
Report Content
Chapter 1. Research Methodology
1.1 Research approach
1.2 Quality Commitments
1.2.1 GMI AI policy & data integrity commitment
1.2.1.1 Source consistency protocol
1.3 Research Trail & Confidence Scoring
1.3.1 Research Trail Components
1.3.2 Scoring Components
1.4 Data Collection
1.4.1 Partial list of primary sources
1.5 Data mining sources
1.5.1 Paid sources
1.5.1.1 Sources, by region
1.6 Base estimates and calculations
1.6.1 Base year calculation for any one approach
1.7 Forecast model
1.7.1 Quantified market impact analysis
1.7.1.1 Mathematical impact of growth parameters on forecast
1.8 Research transparency addendum
1.8.1 Source attribution framework
1.8.2 Quality assurance metrics
1.8.3 Our commitment to trust
Chapter 2. Executive Summary
2.1 Industry 360° synopsis, 2026-2035
2.2 Key market trends
2.2.1 Regional
2.2.2 Product Type
2.2.3 Pressure Output
2.2.4 Application
2.2.5 Distribution Channel
Chapter 3. Industry Insights
3.1 Industry ecosystem analysis
3.1.1 Factor affecting the value chain
3.1.2 Profit margin analysis
3.1.3 Disruptions
3.1.4 Future outlook
3.1.5 Manufacturers
3.1.6 Distributors
3.2 Supplier landscape
3.3 Key news & initiatives
3.4 Technology & Innovation Landscape
3.5 Regulatory landscape
3.6 Impact on forces
3.6.1 Growth drivers
3.6.1.1 Accelerating Global Wastewater Treatment Infrastructure Investment
3.6.1.2 Rising Pneumatic Conveying Demand Across Food, Pharma & Chemical Sectors
3.6.1.3 Stringent Environmental Regulations Driving Forced Aeration System Upgrades
3.6.2 Industry pitfalls & challenges
3.6.2.1 High Initial Capital Cost Relative to Turbo & Centrifugal Blower Alternatives
3.6.2.2 Elevated Energy Consumption Limiting Adoption in Cost-Sensitive Applications
3.6.3 Opportunities
3.6.3.1 Smart & IoT-Enabled Blower Systems Enabling Predictive Maintenance Revenue Models
3.6.3.2 Emerging Market Infrastructure Build-Out (Southeast Asia, Middle East, Sub-Saharan Africa)
3.7 Porter’s analysis
3.8 PESTEL analysis
3.9 Pricing Analysis (Driven by Primary Research)
3.9.1 Historical Price Trend Analysis, 2021-2024 (Driven by Primary Research)
3.9.2 Pricing Strategy by Player Type (Premium / Value / Cost-plus) (Driven by Primary Research)
3.10 Trade data analysis (driven by primary research)
3.10.1 Import/Export Volume & Value Trends by HS Code (HS 8414) (Driven by Primary Research)
3.10.2 Key Trade Corridors & Tariff Impact (US-China, EU-APAC, Intra-Asia) (Driven by Primary Research)
3.11 Impact of AI & Generative AI on the Market
3.11.1 AI-Driven Disruption of Existing Business Models (Predictive Maintenance, Digital Twins)
3.11.2 GenAI Use Cases & Adoption Roadmap by Segment
3.11.3 Risks, Limitations & Regulatory Considerations
3.12 Capacity & Production Landscape (Driven by Primary Research)
3.12.1 Installed Manufacturing Capacity by Region & Key Producer (Driven by Primary Research)
3.12.2 Capacity Utilization Rates & Expansion Pipelines (Driven by Primary Research)
Chapter 4. Competitive Landscape, 2025
4.1 Introduction
4.2 Company market share analysis
4.3 Competitive positioning matrix
4.4 Strategic outlook matrix
4.5 Competitive analysis of major market players
4.6 Key developments
4.6.1 Mergers & acquisitions
4.6.2 Partnerships & collaborations
4.6.3 New product launches
4.6.4 Expansion plans
Chapter 5. Positive Displacement Blowers Market Estimates & Forecast, By Product Type, 2026-2035 (USD Million)
5.1 Key Trends & Product Segment Outlook
5.2 Roots / Lobe Blowers
5.2.1 Twin-Lobe
5.2.2 Tri-Lobe
5.3 Screw Blowers
5.3.1 Single-Screw
5.3.2 Twin-Screw (Oil-Free & Oil-Injected)
5.4 Rotary Vane Blowers
5.5 Claw & Other PD Blowers
5.5.1 Claw-Type Blowers
5.5.2 Scroll & Other Emerging Mechanisms
Chapter 6. Positive Displacement Blowers Market Estimates & Forecast, By Pressure Output, 2026-2035 (USD Million)
6.1 Key Trends & Pressure Segment Outlook
6.2 Low Pressure (Up to 15 PSI)
6.3 Medium Pressure (15 PSI - 30 PSI)
6.4 High Pressure (Above 30 PSI)
Chapter 7. Positive Displacement Blowers Market Estimates & Forecast, By Application, 2026-2035 (USD Million)
7.1 Key Trends & Application Segment Outlook
7.2 Wastewater Treatment
7.2.1 Municipal Wastewater Treatment
7.2.2 Industrial Wastewater Treatment
7.3 Pneumatic Conveying Systems
7.3.1 Dilute Phase Conveying
7.3.2 Dense Phase Conveying
7.4 Cement Production
7.5 Chemical Processing
7.5.1 Bulk Chemical Handling & Transfer
7.5.2 Specialty & Fine Chemical Processing
7.6 Power Generation
7.6.1 Conventional Power Plants (Coal, Gas, Nuclear)
7.6.2 Renewable & Emerging Energy Facilities (Biomass, Hydrogen)
7.7 Others
7.7.1 Metallurgy & Metal Processing
7.7.2 Vacuum Processing
7.7.3 Food & Beverage
7.7.4 Aquaculture & Agriculture
Chapter 8. Positive Displacement Blowers Market Estimates & Forecast, By Distribution Channel, 2026-2035 (USD Million)
8.1 Key Trends & Channel Outlook
8.2 Direct Sales
8.2.1 OEM Direct-to-End-User
8.2.2 Project-Based Engineering & Turnkey Sales
8.3 Indirect Sales
8.3.1 Authorized Distributors & Dealers
8.3.2 EPC Contractors & Systems Integrators
8.3.3 Online & Digital Procurement Channels
Chapter 9. Positive Displacement Blowers Market Estimates & Forecast, By Region, 2026-2035 (USD Million)
9.1 Key Trends & Regional Outlook
9.2 North America
9.2.1 Market Estimates & Forecast, 2026-2035 (USD Million)
9.2.2 By Product Type
9.2.3 By Application
9.2.4 U.S.
9.2.5 Canada
9.3 Europe
9.3.1 Market Estimates & Forecast, 2026-2035 (USD Million)
9.3.2 By Product Type
9.3.3 By Application
9.3.4 Germany
9.3.5 UK
9.3.6 France
9.3.7 Spain
9.3.8 Italy
9.3.9 Netherlands
9.4 Asia Pacific
9.4.1 Market Estimates & Forecast, 2026-2035 (USD Million)
9.4.2 By Product Type
9.4.3 By Application
9.4.4 China
9.4.5 Japan
9.4.6 India
9.4.7 Australia
9.4.8 South Korea
9.5 Latin America
9.5.1 Market Estimates & Forecast, 2026-2035 (USD Million)
9.5.2 By Product Type
9.5.3 By Application
9.5.4 Brazil
9.5.5 Mexico
9.5.6 Argentina
9.6 Middle East & Africa (MEA)
9.6.1 Market Estimates & Forecast, 2026-2035 (USD Million)
9.6.2 By Product Type
9.6.3 By Application
9.6.4 South Africa
9.6.5 Saudi Arabia
9.6.6 UAE
Chapter 10. Competitive Landscape, 2025
10.1 Company Market Share Analysis
10.1.1 Global Market Share, 2025
10.1.2 Regional Market Share by Geography, 2025
10.2 Competitive Positioning Matrix
10.3 Strategic Initiatives Analysis
10.4 Product & Technology Benchmarking (Efficiency Ratings, Noise Levels, Pressure Range)
10.5 Mergers & Acquisitions
10.6 Partnerships & Collaborations
10.7 New Product Launches & Innovations
10.8 R&D Investment Analysis
10.9 Market Concentration Analysis (HHI Index & CR4/CR8 Ratios)
10.10 Vendor Selection Criteria (Reliability, Energy Efficiency, After-Sales, Price)
10.11 Company Tier Benchmarking
10.11.1 Tier Classification Criteria & Qualifying Thresholds
10.11.2 Tier Positioning Matrix by Revenue, Geography & Innovation Capability
Chapter 11. Future Outlook & Strategic Opportunities
11.1 Technology Evolution Roadmap, 2026-2034
11.2 Emerging Application Opportunities (Hydrogen Production, Carbon Capture, Aquaculture)
11.3 Market Attractiveness Analysis by Segment & Region
11.4 Strategic Entry Points & Whitespace Analysis for New Market Participants
11.5 Long-Term Demand Projections by Key End-Use Sector
Chapter 12. Company Profiles
Don't see your key competitors?
The companies listed in this report are a curated selection - not the full competitive universe.
Our market revenue calculations use a bottom-up methodology that accounts for all players across all regions - including manufacturers, distributors, and specialists not individually profiled. The profiles section spotlights strategically significant players; it does not define the scope of our market sizing.
Your competitive landscape may also include
Free customization - up to 20% of report value
Need specific data? Request customization and get the insights tailored to your exact requirements.
For inquiries regarding discounts, bulk purchases, or customization requests, please contact us at [email protected]
Share Content
Add Citations
Avinash Singh. 2026, September. Positive Displacement Blowers Market Size - By Product Type, By Pressure Output, By Application, By Distribution Channel, and Growth Forecast, 2026 - 2035 (Report ID: GMI2626). Global Market Insights Inc. Retrieved November 13, 2026, from https://www.gminsights.com/toc/details/positive-displacement-blowers-market

Positive Displacement Blowers Market
Get a free sample of this report
Positive Displacement Blowers Market Size
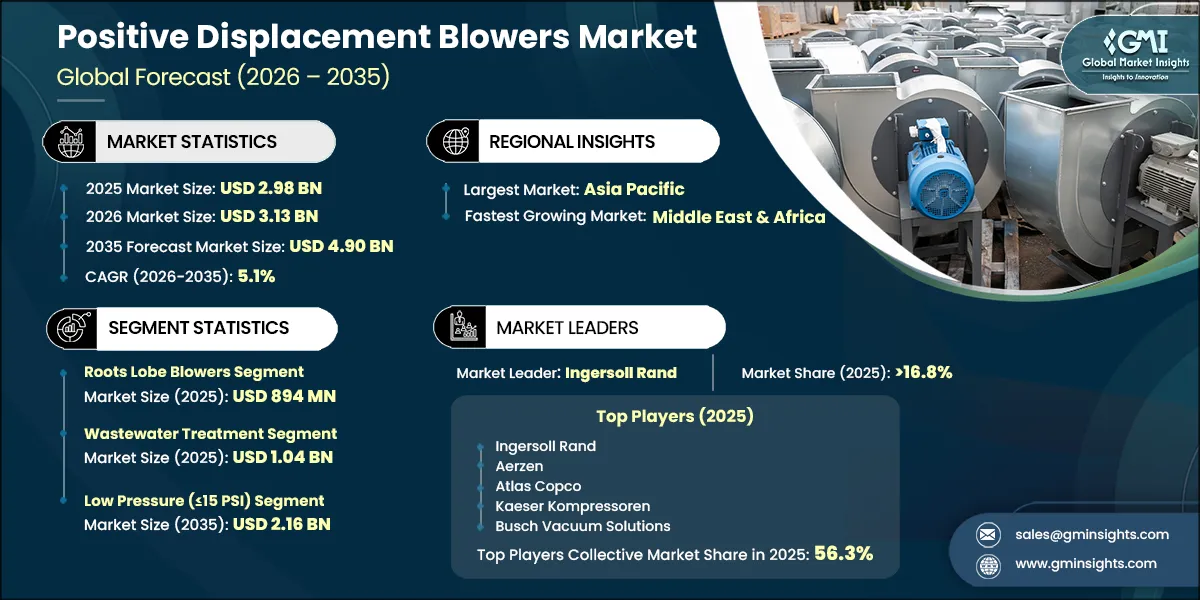
The Positive Displacement Blowers Market was valued at USD 2.98 billion in 2025, projected to reach USD 3.13 billion in 2026, expanding at a 5.1% CAGR (2026–2035) to attain USD 4.90 billion by 2035.
The Positive Displacement Blowers Market is evolving through the convergence of wastewater infrastructure investment, industrial air-quality requirements, and operating-cost scrutiny. Demand increasingly favors equipment that can balance continuous-duty reliability with lower energy use, while municipal budget discipline and industrial approval cycles continue to temper the speed of technology replacement.
GMI Analyst View
Our discussions with market participants and primary research engagements indicate that the global Positive Displacement Blowers Market is on track to reach USD 3.87 billion by 2030, reflecting consistent mid-cycle compounding as wastewater infrastructure buildout and industrial efficiency programs advance concurrently across both mature and high-growth emerging economies.
Positive Displacement Blowers Market Trends, Growth Drivers & GMI Forecast Outlook
Public wastewater investment is enlarging the addressable installed base for aeration systems, while plant operators are placing greater value on lifecycle efficiency, process-air cleanliness, and equipment traceability. The forecast depends on the pace at which these priorities overcome capital constraints in municipal and mid-sized industrial procurement.
Key Drivers
*Evidence anchors use cited external data; demand implications and forecast conditions represent GMI analysis.*
Wastewater projects create demand that is unusually durable because aeration is integral to activated-sludge treatment rather than a discretionary process enhancement. Development-finance commitments to the water sector reinforce the construction pipeline for municipal treatment assets, particularly where urbanization and tighter discharge requirements are expanding treatment coverage. [1]
Industrial efficiency pressure is also reshaping replacement decisions. Operators evaluating conventional lobe equipment against oil-free screw designs increasingly assess energy draw, air quality, noise, controls integration, and maintenance intervals as a connected operating proposition rather than as separate equipment attributes. Regulatory compliance adds urgency in Europe by making whole-system efficiency a procurement requirement for covered equipment. [3]
Key Restraints
*Evidence anchors use cited external data; demand implications and forecast conditions represent GMI analysis.*
Energy exposure can delay equipment replacement even where efficiency gains are technically clear. Municipal utilities and smaller manufacturers often weigh operational savings against the immediate cost of a premium package, installation downtime, and the internal approvals required to alter established equipment specifications. Research on compressed-air systems underscores the operational importance of efficiency improvement, but it does not remove these near-term budget constraints. [2]
Procurement friction is further intensified when buyers lack directly comparable performance data across blower technologies. More structured wire-to-air testing and wastewater energy-audit requirements can improve technical transparency, yet the transition toward consistent benchmarking will take time across specifications, consultant practices, and installed plant standards. [7]
GMI Analyst View
We view the technology transition as more consequential than the headline growth rate: procurement is moving toward blower packages that can demonstrate efficiency, contamination control, and operational visibility together. The near-term opportunity is strongest where compliance and infrastructure expansion coincide, while affordability will continue to determine the pace of conversion in cost-sensitive installations.
Positive Displacement Blowers Market Segment Analysis
By Product Type
Roots Lobe Blowers generated USD 894 million in 2025 and are projected to hold a 28.0% share of Positive Displacement Blowers Market revenue by 2035. Rootslobe designs remain integral to wastewater aeration and bulk-material conveying because they are mechanically familiar, widely serviceable, and suitable for standard low-pressure duties. Their position is being challenged less by demand erosion than by replacement decisions in which energy-intensive, continuous-duty applications increasingly favor screw technology.
Screw Blowers are projected to reach USD 1.81 billion by 2035 and expand at a 6.3% CAGR (2026–2035). Oil-free screw configurations are gaining preference in applications where process-air cleanliness, controllability, and lifecycle energy performance carry greater weight than initial equipment cost. The strongest adoption case is found in wastewater, pharmaceutical production, food processing, and specialty chemical operations where an equipment failure or contamination event can materially affect plant economics.
Rotary Vane Blowers held a 22.0% share of market revenue in 2025 and are projected to generate USD 980 million by 2035. Rotary vane equipment retains relevance in compact, low-pressure, and replacement-oriented uses where a straightforward mechanical architecture is valued. Its competitive space is concentrated in applications that prioritize footprint, established maintenance practices, and modest duty requirements rather than broad efficiency optimization.
Claw & Other Blowers generated USD 447 million in 2025 and are projected to retain a 15.0% share of market revenue by 2035. Claw and scroll technologies address specialized demand where oil-free operation, dry compression, or precision air delivery is required without adopting a full screw-blower package. Food processing, pharmaceutical packaging, aquaculture, printing, and textile conveying provide targeted opportunities for these designs.
By Application
Wastewater Treatment generated USD 1.04 billion in 2025 and is projected to account for 36.0% of market revenue by 2035. Biological treatment systems depend on reliable oxygen delivery, making blower selection a core engineering decision rather than an ancillary purchase. Municipal projects create a substantial installed base, while industrial wastewater operators increasingly seek equipment that can improve air-quality consistency and reduce the operating burden of continuous aeration.
Pneumatic Conveying is projected to reach USD 1.18 billion by 2035 and grow at a 4.7% CAGR (2026–2035). Conveying demand is supported by the need to move powders, pellets, and granular materials in enclosed systems with limited product loss or contamination risk. Dense-phase applications are especially relevant for fragile, abrasive, or high-value materials, strengthening demand for controllable, oil-free blower systems in food, pharmaceutical, and chemical production.
Cement Production is projected to reach USD 490 million by 2035 and grow at a 3.2% CAGR (2026–2035). Cement plants use blower systems for pneumatic transport, fluidization, and combustion-related duties, but their long-lived installed assets slow replacement decisions. Efficiency benefits can support screw-blower adoption, although capital discipline and the availability of functioning legacy equipment constrain the pace of technology conversion.
Chemical Processing generated USD 418 million in 2025 and is projected to account for 15.0% of market revenue by 2035. Bulk chemical handling, fluidized-bed processes, and specialty production require equipment suited to demanding process conditions. Higher-purity chemical and fine-chemical operations are particularly influential in shifting specifications toward oil-free air systems that reduce the risk of process contamination.
Power Generation is projected to generate USD 294 million by 2035 and held a 6.0% market share in 2025. Positive displacement blowers support auxiliary operations such as ash handling, fuel transport, and process-air delivery. Demand is also broadening into biomass, biogas, and emerging hydrogen-related applications, where equipment suppliers are adapting product configurations to new operating conditions and reliability requirements.
Others generated USD 237 million in 2025 and are projected to grow at a 6.4% CAGR (2026–2035). This category includes metallurgy, food and beverage processing, vacuum-related uses, aquaculture, and agriculture. Its momentum reflects the widening use of controlled, oil-free air in hygiene-sensitive production and the importance of dissolved-oxygen management in aquaculture operations.
By Pressure Range
Low Pressure (≤15 PSI) held a 45.0% market share in 2025 and is projected to reach USD 2.16 billion by 2035. Low-pressure demand is anchored in wastewater aeration and mainstream pneumatic conveying, where large operating hours make energy performance particularly visible to end users. This range is the principal arena for lobe-to-screw substitution because it combines a large installed base with frequent opportunities to improve process control.
Medium Pressure (15–30 PSI) generated USD 1.13 billion in 2025 and is projected to account for 38.0% of market revenue by 2035. Medium-pressure duties are common in dense-phase conveying, chemical processing, and industrial fluidization. At these operating points, buyers are more likely to evaluate efficiency, variable-speed capability, and reliability under sustained load, strengthening the competitive case for advanced screw platforms.
High Pressure (>30 PSI) is projected to reach USD 882 million by 2035 and grow at a 5.7% CAGR (2026–2035). High-pressure demand is linked to technically demanding chemical, glass, pharmaceutical, and conveying operations. Modern oil-free screw configurations are extending the addressable range for positive displacement technology where users require dependable pressure delivery and a controlled air stream.
By Distribution Channel
Direct Sales held a 42.0% market share in 2025 and are projected to generate USD 2.01 billion by 2035. Direct engagement is most important in specification-led installations, including municipal treatment projects, EPC contracts, and custom industrial systems. It allows suppliers to influence equipment selection early, coordinate engineering support, and establish long-term service relationships around complex blower packages.
Indirect Sales generated USD 1.73 billion in 2025 and are projected to account for 59.0% of market revenue by 2035. Distributor and integrator networks remain essential for routine replacement demand, local technical support, and access to smaller industrial accounts. Digital purchasing is increasingly relevant for standardized equipment, while system integrators retain a central role in embedding blowers within larger industrial and infrastructure projects.
GMI Analyst View
We see market segmentation becoming increasingly defined by duty profile rather than by a simple product hierarchy. Screw technology is gaining where uptime, clean air, and energy management create a measurable operational case, whereas conventional lobe equipment remains resilient in standardized applications with tight capital budgets and entrenched maintenance practices.
Positive Displacement Blowers Market Regional Analysis
North America Positive Displacement Blowers Market Analysis
The North America Positive Displacement Blowers Market generated USD 864 million in 2025 and is projected to reach USD 1.30 billion by 2035. North American demand is centered on replacement-driven wastewater upgrades, industrial conveying, and process-air applications within a mature manufacturing base. Buyers emphasize reliability, aftermarket responsiveness, and verifiable operating performance, supporting demand for both established lobe systems and advanced screw packages.
U.S. generated USD 726 million in 2025 and is projected to reach USD 1.07 billion by 2035. The U.S. market is underpinned by a large installed base of activated-sludge facilities and extensive industrial demand from food, chemicals, cement, and related process sectors. Equipment replacement is increasingly tied to utility operating targets and lifecycle-cost evaluations, creating favorable conditions for energy-efficient blower configurations.
Europe Positive Displacement Blowers Market Analysis
Europe held a 27.0% market share in 2025 and is projected to generate USD 1.23 billion by 2035. European demand is shaped by industrial modernization and a compliance environment that increasingly treats whole-system efficiency as a procurement criterion. Regulation (EU) 20241834 establishes a new efficiency framework for covered blower and fan systems, directing replacement spending toward compliant equipment.
Germany is projected to reach USD 226 million by 2035 and grow at a 4.0% CAGR (2026–2035). Germany's market benefits from a technically sophisticated base of chemical, manufacturing, and wastewater customers. Its preference for engineered, energy-efficient equipment supports the adoption of premium blower solutions, while domestic industrial expertise reinforces demand for application-specific system design.
Asia Pacific Positive Displacement Blowers Market Analysis
The Asia Pacific Positive Displacement Blowers Market generated USD 1.01 billion in 2025 and is projected to hold a 37.2% share of market revenue by 2035. Asia Pacific combines greenfield wastewater construction with continuing industrial capacity additions across chemicals, cement, food processing, and bulk-material handling. The region therefore supports both standard lobe-blower demand and accelerated adoption of efficient screw designs as operators raise their expectations for process reliability and energy performance.
China accounted for a 15.0% share of global market revenue in 2025 and is projected to reach USD 785 million by 2035. China's demand base spans municipal treatment expansion, industrial conveying, and a broad domestic manufacturing ecosystem. Local suppliers compete strongly in conventional product categories, while international and higher-specification suppliers target applications where efficiency, oil-free air, and controls sophistication are decisive.
Latin America Positive Displacement Blowers Market Analysis
The Latin America Positive Displacement Blowers Market generated USD 179 million in 2025 and is projected to reach USD 311 million by 2035. Municipal wastewater construction, agri-food processing, mining, and industrial expansion support regional demand. Financing for water and sanitation assets can strengthen procurement visibility, but capital availability and price sensitivity continue to favor robust, lower-cost equipment in many projects.
Brazil generated USD 100 million in 2025 and is projected to reach USD 172 million by 2035. Brazil is the region's principal demand center, supported by wastewater-service expansion and process-air requirements in food and beverage, sugar and ethanol, and petrochemical operations. The market rewards suppliers that can pair durable products with responsive local service and commercially practical package pricing.
Middle East & Africa Positive Displacement Blowers Market Analysis
Middle East & Africa held a 4.0% market share in 2025 and is projected to grow at a 7.1% CAGR (2026–2035). The region's outlook is supported by water-treatment investment, desalination-related infrastructure, hydrocarbon processing, and industrial development. Project economics differ across the region, but operational reliability and continuity of supply are consistently important in applications where equipment operates in demanding environments.
UAE held a 1.1% share of global market revenue in 2025 and is projected to grow at a 7.5% CAGR (2026–2035). The UAE's demand is associated with water recycling, industrial parks, petrochemicals, and metals processing. Its preference for high-performance infrastructure creates an attractive environment for suppliers of efficient, engineered blower packages with strong service support.
GMI Analyst View
We expect regional performance to be determined by the character of capital deployment. Asia Pacific is driven by installation demand from new infrastructure and industrial capacity, while North America and Europe are more replacement-led. The Middle East & Africa offers a distinct opportunity for suppliers able to meet reliability, project-execution, and service requirements in infrastructure-intensive applications.
Positive Displacement Blowers Market Share & Competitive Landscape
The Positive Displacement Blowers Market share structure is moderately concentrated, with the top five competitors collectively accounting for 56.3% of global revenue in 2025. Large suppliers are advantaged in complex municipal and industrial projects because they can combine broad product portfolios, engineering support, and service coverage, while regional specialists remain competitive in standardized and price-sensitive applications.
Ingersoll Rand held a 16.8% share of the positive displacement blowers market in 2025. Its position reflects a broad portfolio spanning Gardner Denver, Robuschi, and Elmo Rietschle brands, enabling participation across lobe, screw, and specialized positive displacement applications. The company's manufacturing scale and service footprint support specification-led projects as well as recurring replacement demand.
Aerzen held a 13.6% global market share in 2025. Aerzen's differentiation is closely associated with engineering depth in screw-blower technology and a product offering suited to wastewater and industrial applications that prioritize energy efficiency. Continued product development helps it defend a premium position as lower-cost alternatives expand within conventional blower categories.
Atlas Copco held an 11.9% market share in 2025. Atlas Copco emphasizes oil-free air quality, lifecycle economics, connected monitoring, and global aftermarket capabilities. That positioning is particularly relevant in pharmaceutical, food, and high-specification industrial settings where equipment uptime and process assurance can justify a higher initial investment.
Kaeser Kompressoren maintains strong positioning in wastewater treatment and industrial conveying through its engineered rotary and screw blower portfolio, supported by established aftermarket relationships.
Busch Vacuum Solutions is differentiated by its participation in vacuum-side and specialized process applications, particularly where food and pharmaceutical customers value process control and technical service.
Regional manufacturers in China, India, Japan, and Europe remain important competitive participants, particularly in conventional lobe systems and local application niches. Competitive intensity is therefore split between global suppliers pursuing high-specification projects and localized producers competing on price, delivery responsiveness, and familiarity with regional procurement requirements.
Recent Industry Developments
Kaeser Kompressoren introduced its CBS rotary screw blower series in September 2025 for municipal and industrial wastewater applications, positioning the product around compact installation, energy efficiency, and process-air duties such as aeration, bioreactors, flotation, and fluidization. [4]
Aerzen expanded its Delta Screw VM series with the VM 200 in September 2025, extending the company's offering for high-performance low-pressure industrial-air applications. [5]
Kaeser Kompressoren added BBC and FBC compact rotary blower series in November 2025, targeting pneumatic conveying and water-treatment operators that require connected blower management alongside conventional performance requirements. [6]
Need a specific section of this report?
Purchase regional analysis, country-level analysis, company profiles, or any other segment-level insights separately
based on your research needs.