Medium Voltage Switchgear Market Size & Share 2026-2035
Report ID: GMI2543
|
Published Date: September 2026
|
Report Format: PDF/Excel/Dashboard/Platform
Download Free PDF
Explore our licensing options:
Medium Voltage Switchgear Market Size
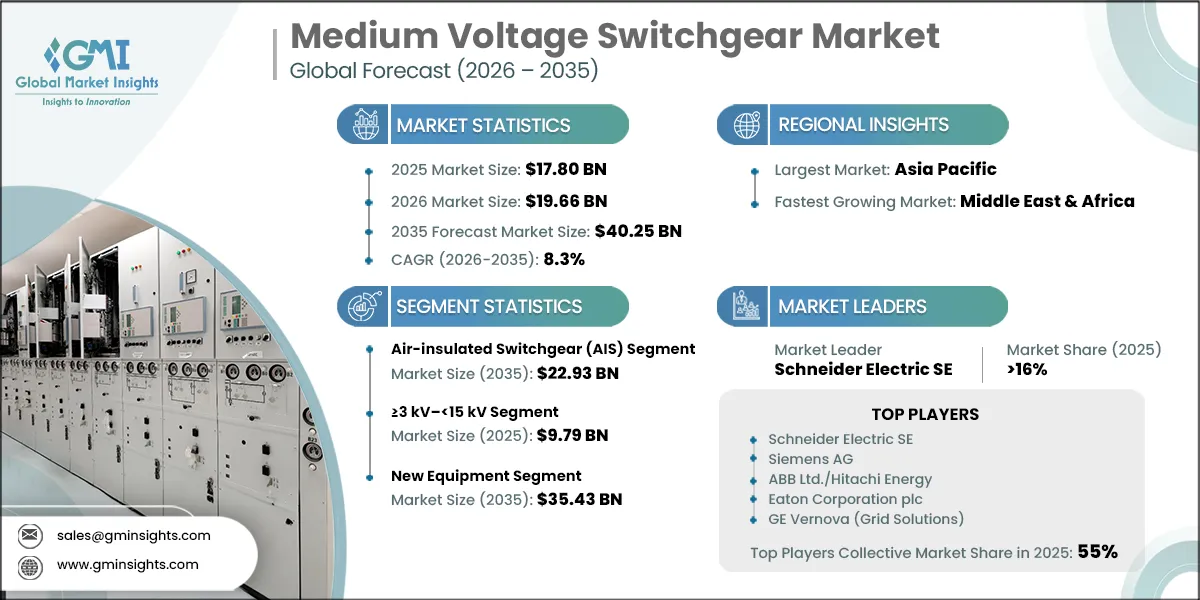
The Medium Voltage Switchgear Market was valued at USD 17.80 billion in 2025, is projected to reach USD 19.66 billion in 2026, and is expected to grow at 8.3% CAGR (2026–2035) to USD 40.25 billion by 2035.
The Medium Voltage Switchgear Market is being reshaped by the parallel need to renew aging distribution infrastructure and connect more decentralized, power-intensive loads. Demand increasingly favors equipment that combines protection, switching, automation, and lifecycle serviceability, shifting procurement toward platforms capable of supporting grid flexibility, industrial continuity, and renewable interconnection.
GMI Analyst View
Based on input from industry leaders across the global MV switchgear supply chain, the five largest equipment suppliers collectively hold approximately 55% of the market in 2025. We see this concentration as a reflection of qualification barriers, installed-base relationships, and the premium utilities place on suppliers that can support equipment through specification, commissioning, maintenance, and modernization.
Medium Voltage Switchgear Market Trends, Growth Drivers & GMI Forecast Outlook
Demand is moving beyond conventional replacement cycles toward broader infrastructure programs that require more resilient, digitally manageable distribution systems. The forecast therefore depends on the conversion of grid investment into equipment orders, the pace of renewable connection activity, and manufacturers' ability to manage the transition to alternative insulation technologies.
Key Drivers
Driver
Evidence signal
Market-demand implication
GMI forecast condition
Grid infrastructure investment expansion
Global electricity grid spending reached USD 400 billion in 2024 [1]International Energy Agency. "World Energy Investment 2024 — Overview and Key Findings." [iea.org]
Rising grid capex expands procurement volumes for MV protection, switching, and control equipment across transmission, distribution, and industrial substation upgrades
Sustained grid modernization spend, supported by policy in Europe, North America, and China, underpins volume and value growth for MV switchgear across all forecast years
Renewable energy integration and grid connection buildout
Global renewable power capacity additions reached 585 GW in 2024 [2]International Renewable Energy Agency. "Record-Breaking Annual Growth in Renewable Power Capacity." [irena.org]
Each generation connection point and distribution substation requires MV interconnection equipment; growing volumes of wind, solar, and hybrid installations multiply annual switchgear requirements per GW of added capacity
Continued large-scale renewable additions at current pace, supported by national deployment mandates and falling generation costs, maintains strong new-connection demand for MV equipment through 2035
Smart grid digitalization and protection mandates
Utility modernization programs mandate integrated protection relays, IEC 61850 communication protocols, and IoT condition monitoring in new MV installations
Grid operators are shifting procurement toward intelligent MV switchgear with embedded sensing and remote diagnostics, raising per-unit specification value and accelerating replacement of legacy equipment
Digital infrastructure programs across advanced and emerging economies sustain a mix-shift toward higher-specification MV units, supporting average value growth beyond headline volume gains over the forecast horizon
Grid investment is commercially significant for switchgear suppliers because spending reaches multiple layers of the electricity system rather than a single asset class. Substation refurbishment, feeder reinforcement, network automation, and industrial service upgrades each require different configurations of protection and switching equipment. This broad exposure gives the market a replacement base as well as new-build demand, while favoring suppliers with both panel-engineering depth and field-service capability.
Renewable deployment expands the number of points at which generation must be protected, isolated, monitored, and connected to distribution networks. The resulting demand is not limited to the generation site; it also extends to collection systems, substations, feeder upgrades, and grid-edge control architectures. Manufacturers that can configure compact and digitally enabled equipment for varied project sizes are better positioned to capture this dispersed project pipeline.
Digitalization changes the economic content of a medium-voltage installation. Condition monitoring, interoperable communications, remote diagnostics, and modern protection schemes make the equipment more integral to network operations, rather than a passive hardware purchase. The shift raises specification requirements and strengthens the value of installed-base service relationships, particularly where utilities are seeking to reduce outage exposure and improve asset visibility.
Key Restraints
Restraint
Evidence signal
Market-demand implication
GMI forecast condition
Developing-market grid investment shortfall
Reaching net-zero power grids by 2030 requires USD 811 billion in annual grid investment, nearly three times current global flows [3]BloombergNEF. "Significant Investment Needed to Ready the Global Power Grid for Net Zero." [bnef.com]
A persistent investment gap in developing and emerging economies constrains utility procurement budgets, limiting MV switchgear rollout in markets with the largest infrastructure deficit
The gap between required and actual investment moderates volume growth in MEA, Latin America, and parts of Southeast Asia, where utility credit conditions and fiscal constraints restrict order realization through at least mid-forecast
Grid connection queue congestion
Renewable capacity waiting for grid connections reached 1,650 GW by July 2024 [4]International Energy Agency. "Renewables 2024 — Electricity." [iea.org]
Congested interconnection queues create procurement timing uncertainty; developers cannot finalize switchgear commissioning until grid connection approvals are secured, slowing order conversion for manufacturers
Prolonged queue clearance and permitting delays dampen near-term MV switchgear order conversion; accelerated interconnection approval programs represent a key upside condition for volume realization through 2028
SF6 phase-out compliance and technology transition complexity
EU Regulation 2024/573 prohibits F-gases in new MV switchgear ≤24 kV from 1 January 2026, extending the restriction to ≤52 kV by 1 January 2030 [5]European Parliament and Council. "Regulation (EU) 2024/573 on Fluorinated Greenhouse Gases." [eur-lex.europa.eu]
Manufacturers and utilities face product redesign, re-certification, and inventory transition costs; buyers evaluating new SF6-free technologies may defer procurement decisions during the technology substitution period
Effective OEM compliance execution and demonstrated SF6-free product performance will determine whether the regulatory transition disrupts or accelerates near-term MV replacement demand in Europe and globally
The investment constraint is most consequential where electricity demand growth and electrification needs are high but utility balance sheets, public budgets, or project-finance structures remain weak. Such markets can have significant physical infrastructure needs without producing a correspondingly reliable equipment order flow. For suppliers, this raises the importance of export-credit support, local financing partnerships, and the ability to adapt commercial terms to longer project-development cycles.
Connection backlogs create an order-timing issue rather than eliminating underlying demand. Developers may advance technical design and supplier engagement before securing final grid access, but commissioning schedules and firm equipment releases can remain exposed to permitting and interconnection decisions. This causes uneven conversion from project pipeline to manufacturing backlog and makes visibility particularly sensitive to regulatory reforms.
The transition away from SF6 introduces a different type of friction: customers must evaluate new equipment platforms, revise specifications, train technical personnel, and manage compatibility with existing facilities. Regulation (EU) 2024/573 establishes the relevant restrictions for new equipment, making demonstrated reliability, certified performance, and available manufacturing capacity central to procurement confidence.
GMI Analyst View
We view the forecast as increasingly differentiated by a market's ability to fund and execute grid investment. Mature systems are moving toward digitally integrated, lower-emission equipment with stronger service intensity, whereas capital-constrained systems may defer otherwise necessary modernization. The result is a market where policy execution and utility finance materially shape demand conversion.
Medium Voltage Switchgear Market Segment Analysis
By Insulation Type
Air-insulated switchgear (AIS) held approximately 65% of market revenue in 2025 at USD 11.57 billion and is projected to reach USD 22.93 billion by 2035. Gas-insulated switchgear (GIS) accounted for 30% at USD 5.34 billion in 2025 and is forecast to grow at 9.5% CAGR (2026–2035) to USD 14.0 billion by 2035. Solid and hybrid-insulated switchgear (SIS/HIS) held 5% of revenue in 2025 and is the fastest-growing sub-segment at 14.0% CAGR.
The Medium Voltage Switchgear Market is undergoing a consequential insulation transition as customers reassess the operating, regulatory, and lifecycle implications of established gas-insulated designs. Gas-insulated products retain an important role where footprint, environmental sealing, and high service continuity are critical, while air-insulated equipment remains relevant in applications that prioritize accessibility, familiar maintenance practices, and lower initial complexity.
The principal competitive issue is no longer insulation performance in isolation, but how effectively an alternative platform fits existing utility and industrial operating practices. Suppliers that can offer SF6-free designs without creating unacceptable compromises in footprint, reliability, technician familiarity, or installed-base support are better placed to convert regulatory pressure into sustained product adoption. The EU framework is accelerating this shift in applicable equipment categories.
By Installation Type
Indoor switchgear held approximately 60% of market revenue in 2025 at USD 10.68 billion and is projected to reach USD 23.35 billion by 2035 at 8.0% CAGR. Outdoor installations accounted for the remaining 40% share at USD 7.12 billion in 2025 and are forecast to grow at 8.8% CAGR (2026–2035), the faster of the two installation formats.
Indoor switchgear is typically selected where controlled environments, integrated protection systems, and space-efficient electrical rooms support higher specification requirements. It is widely used in primary distribution, industrial facilities, commercial infrastructure, and applications where continuity of power supply justifies more sophisticated monitoring and protection architectures.
Outdoor equipment remains essential for feeder extensions, renewable interconnections, remote substations, and sites where constructing a dedicated switchroom is impractical. Modular and packaged-substation approaches are narrowing the distinction between the two formats by combining weather-resistant enclosures with advanced controls. The segment's direction will depend on project designers' preference for standardized, rapidly deployable systems that reduce on-site engineering and installation risk.
By Voltage Range
The ≥3 kV–<15 kV band held approximately 55% of market revenue in 2025 at USD 9.79 billion, reflecting its dominance in secondary distribution networks. The ≥40 kV–<52 kV range, while the smallest sub-segment at 5% of revenue (USD 890 million in 2025), is the fastest-growing voltage tier at 10.5% CAGR (2026–2035).
The voltage-range mix reflects the difference between high-volume secondary distribution and higher-value primary distribution applications. Secondary networks require broad deployment of compact switching and protection equipment, while primary distribution installations demand greater insulation performance, more complex protection coordination, and equipment capable of supporting larger connected loads.
Demand is also becoming more application-specific. Renewable projects, data centers, industrial electrification, and urban distribution reinforcement each impose different requirements for interruption capability, system architecture, digital communication, and physical footprint. This is supporting a broader mix of customized configurations rather than a uniform equipment specification across the medium-voltage range.
By End User
Utilities and transmission and distribution (T&D) operators accounted for approximately 45% of market revenue in 2025 at USD 8.01 billion, representing the largest end-user segment. Transportation infrastructure, at 5% of revenue in 2025, is the fastest-growing end-user category at 11.8% CAGR (2026–2035), followed by renewables and energy infrastructure at 11.2% CAGR.
Utilities remain the core demand base because their network programs require recurring replacement, expansion, automation, and maintenance activity. Their procurement processes typically favor suppliers with proven qualification histories, engineering support, and the capacity to serve multi-year framework arrangements across large and geographically dispersed asset bases.
Industrial users, renewable developers, data center operators, and commercial infrastructure owners each add distinct sources of demand. Industrial buyers prioritize process reliability and maintainability, renewable projects require dependable interconnection packages, and data centers demand resilient power architectures with rapid fault isolation. The growing overlap among these requirements is reinforcing demand for more capable protection, control, and monitoring functions.
By New vs Refurbished Equipment
New equipment accounted for approximately 90% of market revenue in 2025 at USD 16.02 billion and is projected to reach USD 35.43 billion by 2035 at 8.1% CAGR. Refurbished equipment held a 10% share at USD 1.78 billion in 2025 and is the faster-growing sub-segment at 10.5% CAGR (2026–2035).
New equipment demand is supported by grid extensions, greenfield industrial capacity, renewable interconnection, and new digital infrastructure. These projects typically require complete switchgear assemblies designed for contemporary protection standards, communications requirements, and operating conditions.
Refurbishment serves a different but durable need: extending the useful life of equipment where enclosures and bus structures remain viable but breakers, relays, sensors, or communications components require modernization. Digital retrofit programs can improve monitoring and protection without a full replacement outage, making them attractive in facilities where operational continuity constrains capital-project timing. This creates an aftermarket opportunity alongside the transition toward new SF6-free equipment platforms.
GMI Analyst View
We see the segment outlook being defined by the convergence of infrastructure renewal, renewable connection requirements, and increasingly demanding power-quality expectations from industrial and digital loads. These forces are elevating the role of equipment intelligence and lifecycle support. The insulation transition further raises the strategic value of suppliers that can simplify specification and implementation for buyers.
Medium Voltage Switchgear Market Regional Analysis
Asia Pacific Medium Voltage Switchgear Market Analysis
Asia Pacific accounted for approximately 45% of global Medium Voltage Switchgear Market revenue in 2025 and is projected to reach USD 18.52 billion by 2035.The Medium Voltage Switchgear Market in Asia Pacific is supported by the scale of electricity-system expansion, manufacturing investment, urban development, and renewable deployment across the region. China remains a key demand center through distribution reinforcement and large-scale clean-energy integration, while India and Southeast Asia contribute expanding requirements for new substations, industrial power infrastructure, and commercial electrification. The region also provides an important manufacturing base, giving suppliers proximity to high-volume demand and a testing ground for product platforms that can subsequently be deployed internationally.
North America Medium Voltage Switchgear Market Analysis
North America's medium voltage switchgear market was valued at USD 3.92 billion in 2025 and is expected to reach USD 8.45 billion by 2035, driven by aging distribution infrastructure, rising power demand from data centers and industrial facilities, and utility programs focused on network resilience. Buyers frequently require equipment aligned with local technical standards and operating practices, reinforcing the importance of established engineering capabilities, domestic service coverage, and familiar product architectures.
Data-center development is particularly influential because high-availability facilities require substantial and carefully coordinated electrical distribution systems. This supports demand for advanced protection, reliable power-transfer capability, and long-lead procurement planning. The regional opportunity therefore extends beyond replacement demand into higher-specification installations that reward suppliers able to manage engineering complexity and delivery certainty.
Europe Medium Voltage Switchgear Market Analysis
The European medium voltage switchgear market was valued at USD 3.56 billion in 2025 and is projected to account for approximately 20% of global revenue by 2035, shaped by the interaction of grid expansion, aging-asset replacement, and the regulatory transition away from fluorinated insulation gases. European grid investment rose by more than 20% in 2023 to approach USD 65 billion, reflecting the scale of investment needed to accommodate electrification and renewable integration.
The regulatory transition away from fluorinated gases is adding urgency to procurement decisions and product qualification. Utilities and industrial customers are revising technical specifications, assessing clean-insulation alternatives, and evaluating lifecycle implications before placing framework orders. Regulation (EU) 2024/573 is therefore not simply a compliance matter; it is a catalyst for a broader reset of product platforms, supplier relationships, and replacement timing.
Middle East and Africa Medium Voltage Switchgear Market Analysis
The Middle East and Africa market is projected to advance at approximately 9.1% CAGR (2026–2035) to reach USD 3.02 billion by 2035.
The Medium Voltage Switchgear Market in the Middle East and Africa is supported by national electrification strategies, renewable-energy development, industrial diversification, and investment in network reliability. Gulf markets provide visible project pipelines linked to new generation, urban development, industrial zones, and digital infrastructure, while many African markets offer substantial longer-term potential through electrification and distribution buildout.
Realization of that potential remains dependent on utility finance, project-bankability conditions, and the pace at which development funding reaches construction. Suppliers able to combine robust equipment with local service capacity, partnership models, and adaptable commercial structures will be better positioned to participate as projects move from announced demand to executable procurement.
Latin America Medium Voltage Switchgear Market Analysis
Latin America's medium voltage switchgear market was valued at USD 1.07 billion in 2025 and is projected to reach USD 2.21 billion by 2035, anchored by utility investment, renewable integration, industrial development, and the need to strengthen distribution systems across geographically extensive networks. Brazil and Mexico are important demand centers, while other markets can offer targeted opportunities where renewable investment, mining, manufacturing, and infrastructure expansion require new electrical capacity.
Procurement conditions can vary materially across the region because equipment demand is influenced by utility financial health, import exposure, currency conditions, and the pace of public-sector approvals. This favors suppliers with flexible channels, local technical support, and the ability to address both cost-sensitive projects and applications requiring advanced automation or higher reliability.
GMI Analyst View
We view regional performance through the lens of execution capacity rather than headline infrastructure need alone. Asia Pacific combines scale with a deep manufacturing ecosystem, Europe is setting the pace in technology transition, and North America is benefiting from load growth and modernization. Elsewhere, the opportunity is substantial but more closely tied to finance availability, permitting, and project delivery discipline.
Medium Voltage Switchgear Market Share & Competitive Landscape
The Medium Voltage Switchgear Market share structure reflects high barriers around product qualification, design expertise, field service, and customer confidence in long-lived electrical assets. Leading suppliers compete on more than equipment performance: they must provide compliance-ready product portfolios, application engineering, production reliability, digital integration, and lifecycle support. Regional competitors can remain relevant in standardized and price-sensitive applications, but large utilities and complex industrial buyers generally value proven certification and long-term support capability.
Schneider Electric held a 16% revenue share in 2025.
Its competitive position is reinforced by SF6-free product development, digital infrastructure capabilities, and an established presence across utility, industrial, and commercial applications. The company's ability to connect switchgear offerings with broader asset-monitoring and energy-management systems supports customer retention where buyers are prioritizing operational visibility and predictive maintenance.
Siemens held a 15% revenue share in 2025. The company announced a USD 340 million manufacturing investment to expand German power-distribution capacity, including medium-voltage switchgear production.
Siemens competes through its broad installed base, engineering capabilities, and development of clean-air and vacuum-interruption technologies for gas-insulated applications. Expanded manufacturing capacity can strengthen its ability to serve grid, industrial, and data-center demand where delivery timing and product availability are becoming meaningful purchasing criteria.
ABB/Hitachi Energy held a 13% revenue share in 2025.
ABB and Hitachi Energy benefit from complementary capabilities across switchgear, transformers, grid automation, and broader substation solutions. This combination is strategically relevant for utilities and renewable developers seeking coordinated equipment packages rather than isolated components. Their international manufacturing and service presence also supports projects where localization, technical support, and integrated system delivery are important.
Eaton held a 6% revenue share in 2025.
Eaton's market position is closely linked to North American utility, industrial, and data-center demand, where its portfolio addresses established local equipment standards and the need for reliable power distribution. Its broader power-management orientation provides a useful platform for serving customers whose switchgear decisions are increasingly connected to resilience, quality-of-power, and facility-level energy-management requirements.
GE Vernova held a 5% revenue share in 2025.
GE Vernova participates through a grid-focused equipment offering that serves utility modernization, industrial applications, and energy-transition projects. Its focused positioning in electrification and grid solutions can be particularly relevant where customers seek suppliers that understand the interaction between distribution equipment, network reliability, and broader system-upgrade requirements.
Recent Industry Developments
Lucy Group completed its acquisition of Nuventura GmbH on April 2, 2026, adding a Berlin-based developer of primary SF6-free switchgear to Lucy Electric. The transaction extends the group's clean-insulation capabilities and reflects the strategic importance of technology portfolios that can address Europe's evolving switchgear requirements [6]Lucy Group. "Lucy Group Acquires Nuventura GmbH." [lucygroup.com].
Siemens announced an expansion of German switchgear manufacturing capacity, with construction planned at its Frankfurt operation and a supplier facility in Offenbach. The initiative is intended to support demand from data centers, industrial electrification, e-mobility, and grid infrastructure, illustrating the supply-chain response to sustained demand for advanced power-distribution equipment [7]IN Power (electricalnews.co.uk). "Siemens Expands German Switchgear Production Capacity." [electricalnews.co.uk].
Need a specific section of this report?
Purchase regional analysis, country-level analysis, company profiles, or any other segment-level insights separately
based on your research needs.
Authors: Ankit Gupta, Riya Gupta
Medium Voltage Switchgear Market Scope
Medium Voltage Switchgear Market Size
Medium Voltage Switchgear Market Trends
Medium Voltage Switchgear Market Analysis
Medium Voltage Switchgear Market Share
Report Content
Chapter 1. Research Methodology
1.1 Research approach
1.2 Quality Commitments
1.2.1 GMI AI policy & data integrity commitment
1.2.1.1 Source consistency protocol
1.3 Research Trail & Confidence Scoring
1.3.1 Research Trail Components
1.3.2 Scoring Components
1.4 Data Collection
1.4.1 Partial list of primary sources
1.5 Data mining sources
1.5.1 Paid sources
1.5.1.1 Sources, by region
1.6 Base estimates and calculations
1.6.1 Base year calculation
1.7 Forecast model
1.7.1 Quantified market impact analysis
1.7.1.1 Mathematical impact of growth parameters on forecast
1.8 Research transparency addendum
1.8.1 Source attribution framework
1.8.2 Quality assurance metrics
1.8.3 Our commitment to trust
Chapter 2. Executive Summary
2.1 Industry 360° synopsis
2.2 Key market trends
2.2.1 Insulation Type trends
2.2.2 Installation Type trends
2.2.3 Voltage Rating trends
2.2.4 End-User trends
Chapter 3. Industry Insights
3.1 Industry ecosystem analysis
3.1.1 Supplier Landscape
3.1.2 Profit Margin
3.1.3 Cost structure
3.1.4 Value addition at each stage
3.1.5 Factors affecting the value chain
3.1.6 Disruptions
3.2 Industry impact forces
3.2.1 Growth drivers
3.2.2 Industry pitfalls and challenges
3.2.3 Market opportunities
3.3 Growth potential analysis
3.4 Pricing Analysis (Driven by Primary Research)
3.4.1 Historical Price Trend Analysis (Driven by Primary Research)
3.4.2 Pricing Strategy by Player Type (Premium / Value / Cost-plus) (Driven by Primary Research)
3.5 Regulatory landscape
3.5.1 North America
3.5.2 Europe
3.5.3 Asia-Pacific
3.5.4 Latin America
3.5.5 Middle East and Africa
3.6 Porter's analysis
3.7 PESTEL analysis
3.8 Trade Data Analysis (Based on Paid Database)
3.8.1 Import/Export Volume & Value Trends (Based on Paid Database)
4.6.1 Tier classification criteria & qualifying thresholds
4.6.2 Tier positioning matrix by revenue, geography & innovation
Chapter 5. Medium Voltage Switchgear Market Estimates & Forecast, By Insulation Type, 2022 - 2035 ('000 Units, USD Million)
5.1 Key trends, by insulation type
5.2 Air-Insulated Switchgear (AIS)
5.2.1 Metal-Clad AIS
5.2.2 Metal-Enclosed AIS
5.3 Gas-Insulated Switchgear (GIS)
5.3.1 SF₆ GIS
5.3.2 SF₆-Free / Eco-Gas GIS
5.4 Solid/Hybrid Insulated Switchgear (SIS/HIS)
5.4.1 Solid Insulated Switchgear
5.4.2 Hybrid Insulated Switchgear
Chapter 6. Medium Voltage Switchgear Market Estimates & Forecast, By Installation Type, 2022 - 2035 ('000 Units, USD Million)
6.1 Key trends, by installation type
6.2 Indoor Switchgear
6.3 Outdoor Switchgear
Chapter 7. Medium Voltage Switchgear Market Estimates & Forecast, By Voltage Rating, 2022 - 2035 ('000 Units, USD Million)
7.1 Key trends, by voltage rating
7.2 ≥ 3 kV – < 15 kV
7.3 ≥ 15 kV – < 27 kV
7.4 ≥ 27 kV – < 40 kV
7.5 ≥ 40 kV – < 52 kV
Chapter 8. Medium Voltage Switchgear Market Estimates & Forecast, By End-User, 2022 - 2035 ('000 Units, USD Million)
8.1 Key trends, by end-user
8.2 Utilities & Transmission/Distribution
8.3 Industrial
8.4 Commercial & Institutional
8.5 Renewables & Energy Infrastructure
8.6 Transportation Infrastructure
Chapter 9. Medium Voltage Switchgear Market Estimates & Forecast, By Region, 2022 - 2035 ('000 Units, USD Million)
9.1 Key trends, by region
9.2 North America
9.2.1 U.S.
9.2.2 Canada
9.2.3 Mexico
9.3 Europe
9.3.1 Germany
9.3.2 UK
9.3.3 France
9.3.4 Italy
9.3.5 Spain
9.3.6 Rest of Europe
9.4 Asia Pacific
9.4.1 China
9.4.2 India
9.4.3 Japan
9.4.4 South Korea
9.4.5 Australia
9.4.6 Rest of Asia Pacific
9.5 Latin America
9.5.1 Brazil
9.5.2 Argentina
9.5.3 Rest of Latin America
9.6 Middle East & Africa
9.6.1 UAE
9.6.2 Saudi Arabia
9.6.3 South Africa
9.6.4 Rest of Middle East & Africa
Chapter 10. Company Profiles (Driven by Primary Research)
Don't see your key competitors?
The companies listed in this report are a curated selection - not the full competitive universe.
Our market revenue calculations use a bottom-up methodology that accounts for all players across all regions - including manufacturers, distributors, and specialists not individually profiled. The profiles section spotlights strategically significant players; it does not define the scope of our market sizing.
Your competitive landscape may also include
Regional or domestic-only leaders not in the global top tier
Distributors and channel partners who control market access
Emerging disruptors, startups, or adjacent-industry entrants
Niche players focused on a specific application or end-use
Free customization - up to 20% of report value
Need specific data? Request customization and get the insights tailored to your exact requirements.
For inquiries regarding discounts, bulk purchases, or customization requests, please contact us at[email protected]
Over 70% of our clients customize reports to fit their needs. Please tell us how you would like to customize yours below
Share Content
Add Citations
Ankit Gupta. 2026, September. Medium Voltage Switchgear Market Size - By Voltage, By Component, By Insulation, By End Use, By Application, Growth Analysis and Industry Forecast, 2026 - 2035 (Report ID: GMI2543). Global Market Insights Inc. Retrieved November 11, 2026, from https://www.gminsights.com/toc/details/medium-voltage-switchgear-market
Medium Voltage Switchgear Market
Get a free sample of this report
Get a free sample of this report Medium Voltage Switchgear Market
Is your requirement urgent? Please give us your business email for a speedy delivery!



Medium Voltage Switchgear Market Size
The Medium Voltage Switchgear Market was valued at USD 17.80 billion in 2025, is projected to reach USD 19.66 billion in 2026, and is expected to grow at 8.3% CAGR (2026–2035) to USD 40.25 billion by 2035.
The Medium Voltage Switchgear Market is being reshaped by the parallel need to renew aging distribution infrastructure and connect more decentralized, power-intensive loads. Demand increasingly favors equipment that combines protection, switching, automation, and lifecycle serviceability, shifting procurement toward platforms capable of supporting grid flexibility, industrial continuity, and renewable interconnection.
GMI Analyst View
Based on input from industry leaders across the global MV switchgear supply chain, the five largest equipment suppliers collectively hold approximately 55% of the market in 2025. We see this concentration as a reflection of qualification barriers, installed-base relationships, and the premium utilities place on suppliers that can support equipment through specification, commissioning, maintenance, and modernization.
Medium Voltage Switchgear Market Trends, Growth Drivers & GMI Forecast Outlook
Demand is moving beyond conventional replacement cycles toward broader infrastructure programs that require more resilient, digitally manageable distribution systems. The forecast therefore depends on the conversion of grid investment into equipment orders, the pace of renewable connection activity, and manufacturers' ability to manage the transition to alternative insulation technologies.
Key Drivers
Grid investment is commercially significant for switchgear suppliers because spending reaches multiple layers of the electricity system rather than a single asset class. Substation refurbishment, feeder reinforcement, network automation, and industrial service upgrades each require different configurations of protection and switching equipment. This broad exposure gives the market a replacement base as well as new-build demand, while favoring suppliers with both panel-engineering depth and field-service capability.
Renewable deployment expands the number of points at which generation must be protected, isolated, monitored, and connected to distribution networks. The resulting demand is not limited to the generation site; it also extends to collection systems, substations, feeder upgrades, and grid-edge control architectures. Manufacturers that can configure compact and digitally enabled equipment for varied project sizes are better positioned to capture this dispersed project pipeline.
Digitalization changes the economic content of a medium-voltage installation. Condition monitoring, interoperable communications, remote diagnostics, and modern protection schemes make the equipment more integral to network operations, rather than a passive hardware purchase. The shift raises specification requirements and strengthens the value of installed-base service relationships, particularly where utilities are seeking to reduce outage exposure and improve asset visibility.
Key Restraints
The investment constraint is most consequential where electricity demand growth and electrification needs are high but utility balance sheets, public budgets, or project-finance structures remain weak. Such markets can have significant physical infrastructure needs without producing a correspondingly reliable equipment order flow. For suppliers, this raises the importance of export-credit support, local financing partnerships, and the ability to adapt commercial terms to longer project-development cycles.
Connection backlogs create an order-timing issue rather than eliminating underlying demand. Developers may advance technical design and supplier engagement before securing final grid access, but commissioning schedules and firm equipment releases can remain exposed to permitting and interconnection decisions. This causes uneven conversion from project pipeline to manufacturing backlog and makes visibility particularly sensitive to regulatory reforms.
The transition away from SF6 introduces a different type of friction: customers must evaluate new equipment platforms, revise specifications, train technical personnel, and manage compatibility with existing facilities. Regulation (EU) 2024/573 establishes the relevant restrictions for new equipment, making demonstrated reliability, certified performance, and available manufacturing capacity central to procurement confidence.
GMI Analyst View
We view the forecast as increasingly differentiated by a market's ability to fund and execute grid investment. Mature systems are moving toward digitally integrated, lower-emission equipment with stronger service intensity, whereas capital-constrained systems may defer otherwise necessary modernization. The result is a market where policy execution and utility finance materially shape demand conversion.
Medium Voltage Switchgear Market Segment Analysis
By Insulation Type
Air-insulated switchgear (AIS) held approximately 65% of market revenue in 2025 at USD 11.57 billion and is projected to reach USD 22.93 billion by 2035. Gas-insulated switchgear (GIS) accounted for 30% at USD 5.34 billion in 2025 and is forecast to grow at 9.5% CAGR (2026–2035) to USD 14.0 billion by 2035. Solid and hybrid-insulated switchgear (SIS/HIS) held 5% of revenue in 2025 and is the fastest-growing sub-segment at 14.0% CAGR.
The Medium Voltage Switchgear Market is undergoing a consequential insulation transition as customers reassess the operating, regulatory, and lifecycle implications of established gas-insulated designs. Gas-insulated products retain an important role where footprint, environmental sealing, and high service continuity are critical, while air-insulated equipment remains relevant in applications that prioritize accessibility, familiar maintenance practices, and lower initial complexity.
The principal competitive issue is no longer insulation performance in isolation, but how effectively an alternative platform fits existing utility and industrial operating practices. Suppliers that can offer SF6-free designs without creating unacceptable compromises in footprint, reliability, technician familiarity, or installed-base support are better placed to convert regulatory pressure into sustained product adoption. The EU framework is accelerating this shift in applicable equipment categories.
By Installation Type
Indoor switchgear held approximately 60% of market revenue in 2025 at USD 10.68 billion and is projected to reach USD 23.35 billion by 2035 at 8.0% CAGR. Outdoor installations accounted for the remaining 40% share at USD 7.12 billion in 2025 and are forecast to grow at 8.8% CAGR (2026–2035), the faster of the two installation formats.
Indoor switchgear is typically selected where controlled environments, integrated protection systems, and space-efficient electrical rooms support higher specification requirements. It is widely used in primary distribution, industrial facilities, commercial infrastructure, and applications where continuity of power supply justifies more sophisticated monitoring and protection architectures.
Outdoor equipment remains essential for feeder extensions, renewable interconnections, remote substations, and sites where constructing a dedicated switchroom is impractical. Modular and packaged-substation approaches are narrowing the distinction between the two formats by combining weather-resistant enclosures with advanced controls. The segment's direction will depend on project designers' preference for standardized, rapidly deployable systems that reduce on-site engineering and installation risk.
By Voltage Range
The ≥3 kV–<15 kV band held approximately 55% of market revenue in 2025 at USD 9.79 billion, reflecting its dominance in secondary distribution networks. The ≥40 kV–<52 kV range, while the smallest sub-segment at 5% of revenue (USD 890 million in 2025), is the fastest-growing voltage tier at 10.5% CAGR (2026–2035).
The voltage-range mix reflects the difference between high-volume secondary distribution and higher-value primary distribution applications. Secondary networks require broad deployment of compact switching and protection equipment, while primary distribution installations demand greater insulation performance, more complex protection coordination, and equipment capable of supporting larger connected loads.
Demand is also becoming more application-specific. Renewable projects, data centers, industrial electrification, and urban distribution reinforcement each impose different requirements for interruption capability, system architecture, digital communication, and physical footprint. This is supporting a broader mix of customized configurations rather than a uniform equipment specification across the medium-voltage range.
By End User
Utilities and transmission and distribution (T&D) operators accounted for approximately 45% of market revenue in 2025 at USD 8.01 billion, representing the largest end-user segment. Transportation infrastructure, at 5% of revenue in 2025, is the fastest-growing end-user category at 11.8% CAGR (2026–2035), followed by renewables and energy infrastructure at 11.2% CAGR.
Utilities remain the core demand base because their network programs require recurring replacement, expansion, automation, and maintenance activity. Their procurement processes typically favor suppliers with proven qualification histories, engineering support, and the capacity to serve multi-year framework arrangements across large and geographically dispersed asset bases.
Industrial users, renewable developers, data center operators, and commercial infrastructure owners each add distinct sources of demand. Industrial buyers prioritize process reliability and maintainability, renewable projects require dependable interconnection packages, and data centers demand resilient power architectures with rapid fault isolation. The growing overlap among these requirements is reinforcing demand for more capable protection, control, and monitoring functions.
By New vs Refurbished Equipment
New equipment accounted for approximately 90% of market revenue in 2025 at USD 16.02 billion and is projected to reach USD 35.43 billion by 2035 at 8.1% CAGR. Refurbished equipment held a 10% share at USD 1.78 billion in 2025 and is the faster-growing sub-segment at 10.5% CAGR (2026–2035).
New equipment demand is supported by grid extensions, greenfield industrial capacity, renewable interconnection, and new digital infrastructure. These projects typically require complete switchgear assemblies designed for contemporary protection standards, communications requirements, and operating conditions.
Refurbishment serves a different but durable need: extending the useful life of equipment where enclosures and bus structures remain viable but breakers, relays, sensors, or communications components require modernization. Digital retrofit programs can improve monitoring and protection without a full replacement outage, making them attractive in facilities where operational continuity constrains capital-project timing. This creates an aftermarket opportunity alongside the transition toward new SF6-free equipment platforms.
GMI Analyst View
We see the segment outlook being defined by the convergence of infrastructure renewal, renewable connection requirements, and increasingly demanding power-quality expectations from industrial and digital loads. These forces are elevating the role of equipment intelligence and lifecycle support. The insulation transition further raises the strategic value of suppliers that can simplify specification and implementation for buyers.
Medium Voltage Switchgear Market Regional Analysis
Asia Pacific Medium Voltage Switchgear Market Analysis
Asia Pacific accounted for approximately 45% of global Medium Voltage Switchgear Market revenue in 2025 and is projected to reach USD 18.52 billion by 2035.The Medium Voltage Switchgear Market in Asia Pacific is supported by the scale of electricity-system expansion, manufacturing investment, urban development, and renewable deployment across the region. China remains a key demand center through distribution reinforcement and large-scale clean-energy integration, while India and Southeast Asia contribute expanding requirements for new substations, industrial power infrastructure, and commercial electrification. The region also provides an important manufacturing base, giving suppliers proximity to high-volume demand and a testing ground for product platforms that can subsequently be deployed internationally.
North America Medium Voltage Switchgear Market Analysis
North America's medium voltage switchgear market was valued at USD 3.92 billion in 2025 and is expected to reach USD 8.45 billion by 2035, driven by aging distribution infrastructure, rising power demand from data centers and industrial facilities, and utility programs focused on network resilience. Buyers frequently require equipment aligned with local technical standards and operating practices, reinforcing the importance of established engineering capabilities, domestic service coverage, and familiar product architectures.
Data-center development is particularly influential because high-availability facilities require substantial and carefully coordinated electrical distribution systems. This supports demand for advanced protection, reliable power-transfer capability, and long-lead procurement planning. The regional opportunity therefore extends beyond replacement demand into higher-specification installations that reward suppliers able to manage engineering complexity and delivery certainty.
Europe Medium Voltage Switchgear Market Analysis
The European medium voltage switchgear market was valued at USD 3.56 billion in 2025 and is projected to account for approximately 20% of global revenue by 2035, shaped by the interaction of grid expansion, aging-asset replacement, and the regulatory transition away from fluorinated insulation gases. European grid investment rose by more than 20% in 2023 to approach USD 65 billion, reflecting the scale of investment needed to accommodate electrification and renewable integration.
The regulatory transition away from fluorinated gases is adding urgency to procurement decisions and product qualification. Utilities and industrial customers are revising technical specifications, assessing clean-insulation alternatives, and evaluating lifecycle implications before placing framework orders. Regulation (EU) 2024/573 is therefore not simply a compliance matter; it is a catalyst for a broader reset of product platforms, supplier relationships, and replacement timing.
Middle East and Africa Medium Voltage Switchgear Market Analysis
The Middle East and Africa market is projected to advance at approximately 9.1% CAGR (2026–2035) to reach USD 3.02 billion by 2035.
The Medium Voltage Switchgear Market in the Middle East and Africa is supported by national electrification strategies, renewable-energy development, industrial diversification, and investment in network reliability. Gulf markets provide visible project pipelines linked to new generation, urban development, industrial zones, and digital infrastructure, while many African markets offer substantial longer-term potential through electrification and distribution buildout.
Realization of that potential remains dependent on utility finance, project-bankability conditions, and the pace at which development funding reaches construction. Suppliers able to combine robust equipment with local service capacity, partnership models, and adaptable commercial structures will be better positioned to participate as projects move from announced demand to executable procurement.
Latin America Medium Voltage Switchgear Market Analysis
Latin America's medium voltage switchgear market was valued at USD 1.07 billion in 2025 and is projected to reach USD 2.21 billion by 2035, anchored by utility investment, renewable integration, industrial development, and the need to strengthen distribution systems across geographically extensive networks. Brazil and Mexico are important demand centers, while other markets can offer targeted opportunities where renewable investment, mining, manufacturing, and infrastructure expansion require new electrical capacity.
Procurement conditions can vary materially across the region because equipment demand is influenced by utility financial health, import exposure, currency conditions, and the pace of public-sector approvals. This favors suppliers with flexible channels, local technical support, and the ability to address both cost-sensitive projects and applications requiring advanced automation or higher reliability.
GMI Analyst View
We view regional performance through the lens of execution capacity rather than headline infrastructure need alone. Asia Pacific combines scale with a deep manufacturing ecosystem, Europe is setting the pace in technology transition, and North America is benefiting from load growth and modernization. Elsewhere, the opportunity is substantial but more closely tied to finance availability, permitting, and project delivery discipline.
Medium Voltage Switchgear Market Share & Competitive Landscape
The Medium Voltage Switchgear Market share structure reflects high barriers around product qualification, design expertise, field service, and customer confidence in long-lived electrical assets. Leading suppliers compete on more than equipment performance: they must provide compliance-ready product portfolios, application engineering, production reliability, digital integration, and lifecycle support. Regional competitors can remain relevant in standardized and price-sensitive applications, but large utilities and complex industrial buyers generally value proven certification and long-term support capability.
Schneider Electric held a 16% revenue share in 2025.
Its competitive position is reinforced by SF6-free product development, digital infrastructure capabilities, and an established presence across utility, industrial, and commercial applications. The company's ability to connect switchgear offerings with broader asset-monitoring and energy-management systems supports customer retention where buyers are prioritizing operational visibility and predictive maintenance.
Siemens held a 15% revenue share in 2025. The company announced a USD 340 million manufacturing investment to expand German power-distribution capacity, including medium-voltage switchgear production.
Siemens competes through its broad installed base, engineering capabilities, and development of clean-air and vacuum-interruption technologies for gas-insulated applications. Expanded manufacturing capacity can strengthen its ability to serve grid, industrial, and data-center demand where delivery timing and product availability are becoming meaningful purchasing criteria.
ABB/Hitachi Energy held a 13% revenue share in 2025.
ABB and Hitachi Energy benefit from complementary capabilities across switchgear, transformers, grid automation, and broader substation solutions. This combination is strategically relevant for utilities and renewable developers seeking coordinated equipment packages rather than isolated components. Their international manufacturing and service presence also supports projects where localization, technical support, and integrated system delivery are important.
Eaton held a 6% revenue share in 2025.
Eaton's market position is closely linked to North American utility, industrial, and data-center demand, where its portfolio addresses established local equipment standards and the need for reliable power distribution. Its broader power-management orientation provides a useful platform for serving customers whose switchgear decisions are increasingly connected to resilience, quality-of-power, and facility-level energy-management requirements.
GE Vernova held a 5% revenue share in 2025.
GE Vernova participates through a grid-focused equipment offering that serves utility modernization, industrial applications, and energy-transition projects. Its focused positioning in electrification and grid solutions can be particularly relevant where customers seek suppliers that understand the interaction between distribution equipment, network reliability, and broader system-upgrade requirements.
Recent Industry Developments
Lucy Group completed its acquisition of Nuventura GmbH on April 2, 2026, adding a Berlin-based developer of primary SF6-free switchgear to Lucy Electric. The transaction extends the group's clean-insulation capabilities and reflects the strategic importance of technology portfolios that can address Europe's evolving switchgear requirements [6]Lucy Group. "Lucy Group Acquires Nuventura GmbH." [lucygroup.com].
Siemens announced an expansion of German switchgear manufacturing capacity, with construction planned at its Frankfurt operation and a supplier facility in Offenbach. The initiative is intended to support demand from data centers, industrial electrification, e-mobility, and grid infrastructure, illustrating the supply-chain response to sustained demand for advanced power-distribution equipment [7]IN Power (electricalnews.co.uk). "Siemens Expands German Switchgear Production Capacity." [electricalnews.co.uk].
Need a specific section of this report?
Purchase regional analysis, country-level analysis, company profiles, or any other segment-level insights separately
based on your research needs.