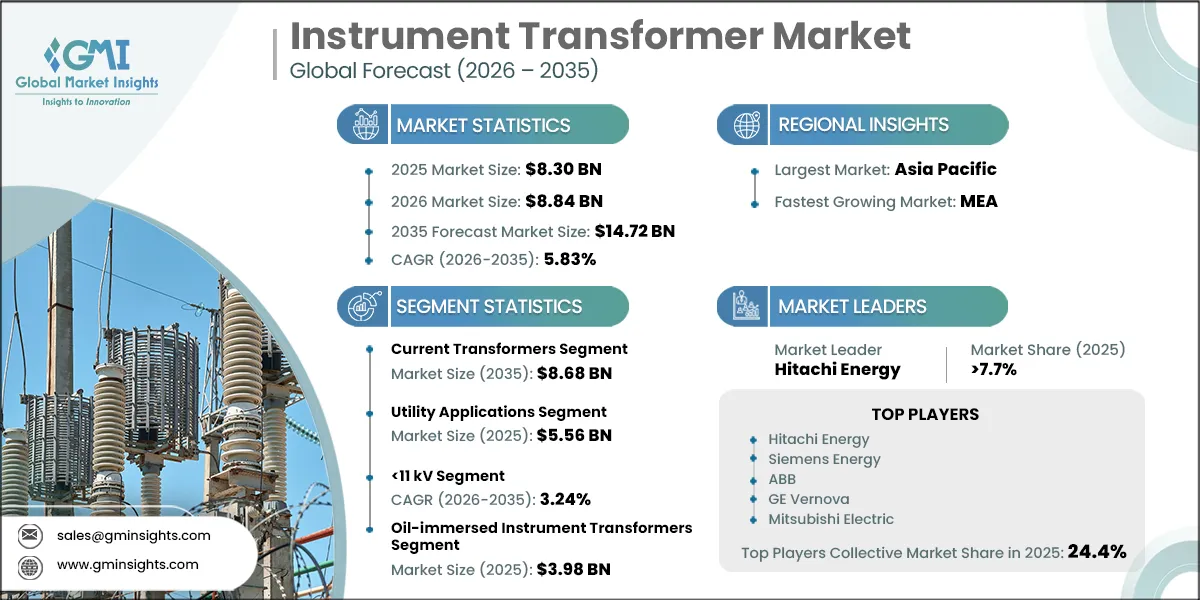
The Instrument Transformer Market was valued at USD 8.30 billion in 2025, is projected to reach USD 8.84 billion in 2026, and is expected to grow at a 5.83% CAGR (2026–2035) to reach USD 14.72 billion by 2035. The market comprises current transformers (CTs) and voltage, potential, and capacitive voltage transformers used to provide isolated measurements for protection, revenue metering, and energy monitoring across transmission and distribution systems.
Market expansion is being shaped by the replacement of aging substation equipment alongside greenfield transmission capacity required for renewable integration and expanding electricity loads. Procurement is increasingly weighted toward higher-accuracy, digital-ready equipment, raising revenue intensity even where project delivery schedules constrain the pace of equipment commissioning.
GMI Analyst View
Based on our discussions with procurement executives across major utilities and substation project developers, global instrument transformer shipments reached approximately 3,375 thousand units in 2025. The shipment profile indicates that utilities are specifying more technically demanding equipment for grid-critical positions, supporting revenue expansion through a richer mix of higher-voltage and higher-accuracy products.
Instrument Transformer Market Trends, Growth Drivers & GMI Forecast Outlook
Grid investment commitments are broadening the addressable equipment pipeline, but project permitting, supply-chain lead times, and insulation redesign requirements will determine how quickly commitments convert into installed substation capacity. The forecast reflects a transition toward digitally compatible, higher-voltage, and lower-emission product configurations.
Key Drivers
Driver
Evidence signal
Market-demand implication
GMI forecast condition
Global grid infrastructure investment
Global grid infrastructure spending is approximately USD 400 billion per year [1]
Sustained, large-scale procurement flow for instrument transformers across utility metering and protection channels worldwide
Instrument transformer demand scales with grid CAPEX allocation; accelerated investment scenarios support the upper end of the 5.83% CAGR forecast
China 15th Five-Year Plan grid expansion
State Grid Corporation of China committed USD 574 billion to power grid infrastructure under its 15th Five-Year Plan [3]
Concentrated, high-volume IT procurement across UHV, HV, and distribution network build-out projects within the world's largest single IT market
SGCC capex execution pace determines whether Asia Pacific delivers mid-range or upper-range forecast; UHV acceleration benefits >800 kV voltage class
Digital substation transition and IEC 61850 adoption
Utilities mandating IEC 61850 protocol compliance for new substation bays are specifying combined IT platforms integrating metering, protection, and communications
Shortens IT replacement cycles; drives upsell toward higher-accuracy classes and combined protection-metering configurations
Faster IEC 61850 retrofit programs support mid-to-upper segment forecast, particularly for HV/EHV combined ITs in Europe and North America
*Evidence anchors use cited external data; demand implications and forecast conditions represent GMI analysis.*
Grid capital programs create demand at several points in the equipment cycle: new lines require protection and metering at terminal substations, while upgraded bays require replacement measurement equipment compatible with contemporary relay architectures. Supply constraints for transformers and cables mean manufacturers with qualified capacity can convert framework agreements into durable order visibility, even when installation schedules move unevenly across markets.
China's grid program is particularly consequential because UHV corridors, backbone-network reinforcement, and distribution automation require different transformer configurations within the same investment cycle. UHV projects favor specialized high-voltage equipment, while urban and regional network upgrades create broader CT and VT demand across feeder protection and revenue-metering positions.
Digital substations change the commercial logic from stand-alone device procurement toward systems compatibility. Utilities replacing analog relay environments increasingly evaluate accuracy class, process-bus connectivity, communications integration, and long-term certification together, increasing the importance of engineering depth and installed-base service capability.
Key Restraints
Restraint
Evidence signal
Market-demand implication
GMI forecast condition
Grid investment shortfall vs. climate targets
IEA projects that grid investment needs to nearly double to over USD 600 billion annually to meet national climate targets [2]
The gap between current investment and the required level tightens utility procurement budgets, particularly in emerging and developing economies
Persistent under-investment in distribution networks compresses volume growth in lower-voltage IT classes; forecast assumes gradual improvement
SF6 regulatory redesign burden
SF6 gas-insulated instrument transformers represent 28.0% of global instrument transformer revenue; EU Regulation (EU) 2024/573 mandates SF6-free alternatives in MV electrical switchgear (≤24 kV) from January 2026 [4]
Manufacturers face margin compression from product redesign; non-EU utilities may defer SF6 equipment purchases pending global regulatory clarity
EU SF6 phase-out creates product-transition friction through 2030; forecast assumes gradual shift to solid and eco-gas alternatives
Supply chain tightness and permitting delays
Tight supply chains for transformers and cables, and lengthy permitting processes, constrain the pace at which grid investment translates into commissioned equipment; grid infrastructure typically takes 5–15 years to plan, permit, and complete.
Supply chain normalization expected from 2027 as expansions come online; permitting bottlenecks keep near-term growth below backlog potential
*Evidence anchors use cited external data; demand implications and forecast conditions represent GMI analysis.*
The investment gap is not uniform across the market. Utilities with credible cost-recovery mechanisms can sustain renewal programs, whereas financially constrained distribution operators may defer network expansion and prioritize maintenance over new capacity. That divergence limits near-term demand conversion in lower-voltage applications, particularly where public funding and utility creditworthiness remain uncertain.
The EU's F-Gas framework is creating a more immediate redesign challenge for suppliers of gas-insulated systems. The regulation changes equipment-selection criteria for new switchgear installations and pushes manufacturers to qualify solid-insulated and alternative-gas configurations while customers assess lifecycle performance, footprint, and compatibility with existing substation layouts.
Long project-development timelines also delay final equipment specifications. Instrument transformer suppliers may receive early indications of demand through framework agreements and EPC engagement, yet revenue recognition depends on permitting, construction sequencing, and the availability of related grid equipment. Tight transformer and cable supply chains compound this timing risk [2].
GMI Analyst View
We view the market's central tension as execution rather than demand creation. Grid programs are expanding the equipment pipeline, but the suppliers best positioned to benefit will be those that can meet technical qualification requirements, manage long lead-time components, and offer compliant alternatives as procurement standards evolve.
Instrument Transformer Market Segment Analysis
By Product Type
Current transformers generated USD 4.73 billion in revenue in 2025 and are projected to generate USD 8.68 billion by 2035. Current transformers benefit from their essential role in feeder protection, bus protection, transformer-bay monitoring, and revenue metering. Renewable-connected substations require more measurement points and tighter protection coordination, strengthening demand for high-accuracy and digitally integrated CT configurations.
Voltage transformers and capacitive voltage transformers generated USD 3.56 billion in 2025 and are expected to hold a 41.0% share in 2035. VT and CVT demand remains closely associated with transmission-level voltage measurement, bus protection, and high-voltage metering. Their role in EHV and UHV stations preserves a technically demanding addressable market, although expanding current-measurement requirements in modern protection schemes moderate their relative mix position.
By Application
Utility applications generated USD 5.56 billion in 2025 and are expected to represent 70.0% of the market in 2035. Utilities procure instrument transformers through long-cycle grid renewal, transmission expansion, and digital-substation programs. Their preference for certified suppliers, repeatable platform designs, and framework procurement gives established vendors greater visibility than project-by-project commercial demand.
Industrial applications are projected to generate USD 2.79 billion by 2035 and represented 20.0% of the market in 2025. Industrial demand is concentrated in energy-intensive facilities where electrical protection, process continuity, and billing-quality measurement are operational requirements. Petrochemicals, mining, steel, and large data-center campuses provide demand for equipment that can operate reliably under site-specific load, environmental, and safety conditions.
Commercial applications represented 13.0% of the market in 2025 and are expected to grow at a 3.89% CAGR (2026–2035). Commercial installations typically require lower-voltage equipment with less demanding measurement and protection specifications than utility or industrial sites. Growth remains supported by urban power infrastructure, but pricing pressure and embedded metering alternatives limit revenue intensity.
By Voltage Rating
The <11 kV segment represented 10.0% of the market in 2025 and is projected to expand at a 3.24% CAGR (2026–2035). Low-voltage applications are influenced by distribution modernization and commercial electrical installations, but standardized specifications and broad supplier availability make this category more exposed to pricing competition than higher-voltage classes.
The 11–33 kV segment generated USD 2.40 billion in 2025 and is expected to hold a 27.0% share in 2035. Medium-voltage equipment serves a wide installed base spanning distribution substations, industrial switchgear, and commercial metering. Demand is geographically diverse, although higher-voltage equipment is expected to gain relative importance as transmission investment accelerates.
The 33–66 kV segment is projected to generate USD 2.35 billion by 2035 and represented 17.0% of the market in 2025. Sub-high-voltage systems connect primary distribution networks with the transmission system. Investment in regional substations, distributed generation interconnections, and network reinforcement sustains demand, particularly where grid operators are addressing load growth outside major urban centers.
The 66–220 kV segment generated USD 1.82 billion in 2025 and is expected to grow at a 6.35% CAGR (2026–2035). High-voltage equipment benefits from replacement programs and the construction of new transmission substations. The category commands higher engineering and qualification requirements because protection failures at these voltage levels carry larger system-reliability consequences.
The 220–800 kV segment is projected to generate USD 2.50 billion by 2035 and represented 15.0% of the market in 2025. EHV demand is tied to large-scale renewable integration, interregional transmission, and long-distance power-transfer projects. Suppliers must combine high-voltage design expertise with factory testing capability and utility-specific certifications, raising the barriers to entry.
The >800 kV segment is expected to represent 9.0% of the market in 2035 and grow at an 8.82% CAGR (2026–2035). UHV deployment is concentrated in systems that move power across long distances between generation and load centers. The segment's growth is driven less by broad-based replacement demand than by a limited number of technically intensive corridor and converter-station projects.
By Insulation Type
Oil-immersed instrument transformers generated USD 3.98 billion in 2025 and are expected to represent 42.0% of the market in 2035. Oil-immersed designs retain a strong position in outdoor HV and EHV substations because of their established service record, thermal performance, and suitability for demanding climate conditions. Their mature supply base also supports continued use in refurbishment and replacement projects.
SF6 gas-insulated instrument transformers generated USD 2.32 billion in 2025 and are expected to grow at a 5.41% CAGR (2026–2035). Gas-insulated products remain important in space-constrained installations, particularly where equipment must integrate with GIS platforms. However, the European regulatory shift toward SF6-free switchgear is accelerating qualification work for alternative designs and changing utility specifications for new installations.
Solid cast-resin and epoxy instrument transformers are projected to generate USD 3.09 billion by 2035 and grow at a 9.08% CAGR (2026–2035). Solid-insulated products are gaining relevance where operators seek lower-maintenance, environmentally compatible, and digitally adaptable equipment. Their performance in indoor and constrained installations is expanding their role as utilities and EPCs reconsider insulation choices for new medium-voltage projects.
Air-core instrument transformers represented 6.0% of the market in 2025 and are projected to grow at a 7.67% CAGR (2026–2035). Air-core designs address applications where linearity, saturation resistance, and compatibility with electronic measurement systems are especially valuable. Their use in digital protection platforms supports a differentiated role despite their narrower installed base.
Other insulation types, including eco-gas and vacuum solutions, are expected to represent 3.0% of the market in 2035 and grow at a 10.70% CAGR (2026–2035). Alternative insulation technologies are benefiting from regulatory and customer pressure to reduce reliance on fluorinated gases. Commercial success will depend on field validation, standards compliance, supply availability, and the ability to meet utility reliability expectations across voltage classes.
By Winding Type
Two-winding instrument transformers generated USD 6.47 billion in 2025 and are expected to account for 76.0% of the market in 2035. Two-winding designs remain the default across conventional metering and protection applications because they are broadly certified, compatible with installed relay systems, and supported by an established manufacturing ecosystem.
Auto-wound instrument transformers are projected to generate USD 3.53 billion by 2035 and grow at a 6.86% CAGR (2026–2035). Auto-wound configurations can offer footprint and material-efficiency benefits in selected high-current and space-constrained applications. Their adoption is advancing where substation engineering priorities favor compact layouts and application-specific optimization.
GMI Analyst View
We see segment performance increasingly determined by specification intensity rather than unit volume alone. Utility-led investment, digital protection requirements, and insulation substitution are shifting competitive advantage toward suppliers that can combine certified high-voltage designs, systems integration, and repeatable manufacturing quality.
Instrument Transformer Market Regional Analysis
North America Instrument Transformer Market Analysis
North America generated USD 1.45 billion in 2025 and is expected to grow at a 5.16% CAGR (2026–2035). The Instrument Transformer Market in North America is anchored by the replacement of aging substation assets, renewable interconnection projects, grid-hardening requirements, and expanding large-load connections. Procurement is typically governed by utility standards, long planning cycles, and rigorous product qualification, favoring suppliers with established service and testing capabilities.
United States
The United States generated USD 1.24 billion in 2025 and is projected to grow at a 5.3% CAGR (2026–2035). Transmission development, substation automation, and large industrial and data-center interconnections are broadening demand for high-voltage measurement and protection equipment. Supply shortages in U.S. grid equipment have also reinforced the strategic value of local manufacturing capacity and dependable delivery performance [7].
Canada
Canada represented 11.0% of North American revenue in 2025 and is projected to generate USD 240 million by 2035. Hydroelectric interconnections, renewable development, and provincial grid reinforcement programs support demand across HV and EHV applications. Utility investment is concentrated in projects that improve regional transfer capacity and strengthen the resilience of aging networks.
Europe Instrument Transformer Market Analysis
Europe represented 19.0% of the market in 2025 and is projected to generate USD 2.67 billion by 2035. European demand is shaped by cross-border transmission reinforcement, renewable integration, and the replacement of legacy substation equipment. The F-Gas regulatory framework is also altering equipment selection by accelerating demand for SF6-free configurations in relevant new switchgear projects.
Germany
Germany generated USD 332 million in 2025 and is projected to grow at a 5.8% CAGR (2026–2035). North-to-south power corridors and offshore-wind interconnection are creating concentrated demand for HV and EHV substation equipment. Distribution modernization adds a separate demand stream for compliant medium-voltage products as operators update urban and industrial networks.
United Kingdom
The United Kingdom represented 12.0% of European revenue in 2025 and is projected to generate USD 322 million by 2035. Offshore wind connections, transmission reinforcement, and interconnector development sustain demand for protection and metering equipment. The market favors suppliers able to meet utility-specific qualification requirements across conventional and digital-substation applications.
France
France is projected to generate USD 370 million by 2035 and represented 14.0% of European revenue in 2025. Transmission investment supporting nuclear, offshore wind, and network reinforcement provides demand across high-voltage systems. Distribution modernization also supports CT and VT procurement for feeder automation, measurement, and grid-management functions.
Asia Pacific Instrument Transformer Market Analysis
Asia Pacific represented 53.0% of the market in 2025 and is projected to generate USD 8.01 billion by 2035. The Instrument Transformer Market in Asia Pacific is defined by a combination of large-scale grid construction, rapidly expanding renewable capacity, distribution modernization, and concentrated investment in high-voltage transmission. China and India are central to regional demand, while Japan and South Korea provide technically sophisticated replacement and upgrade markets.
China
China generated USD 2.91 billion in 2025 and is projected to grow at a 6.1% CAGR (2026–2035). China's demand is underpinned by SGCC investment in UHV corridors, transmission reinforcement, and intelligent distribution networks. Domestic manufacturers are well positioned in volume procurement, while suppliers with specialized UHV certifications retain opportunities in technically demanding projects.
India
India generated USD 623 million in 2025 and is projected to grow at an 8.7% CAGR (2026–2035). Transmission expansion, distribution reform, smart-metering deployment, and renewable-generation interconnection are creating demand across multiple voltage classes. The breadth of these programs supports both standardized distribution equipment and higher-specification products for new transmission substations.
Japan
Japan is projected to generate USD 319 million by 2035 and grow at a 2.0% CAGR (2026–2035). Japan's market is primarily replacement-led, reflecting a mature installed base and tightly regulated utility procurement. Demand remains technically sophisticated because resilience, reliability, and compatibility with established substation standards are central purchasing considerations.
South Korea
South Korea represented 5.0% of Asia Pacific revenue in 2025 and is projected to generate USD 381 million by 2035. Transmission reinforcement, offshore wind interconnection, and new industrial-power requirements support investment in substation equipment. Domestic manufacturing capability and utility procurement practices influence competitive access, particularly in higher-voltage applications.
Latin America Instrument Transformer Market Analysis
Latin America is projected to generate USD 803 million by 2035 and grow at a 5.79% CAGR (2026–2035). Regional demand is led by Brazil and is supported by renewable interconnections, hydroelectric capacity, mining, and expanding urban electricity consumption. Investment conversion remains sensitive to utility finances and macroeconomic conditions, creating a more uneven project pipeline than in larger developed markets.
Brazil
Brazil generated USD 205 million in 2025 and is projected to grow at a 5.9% CAGR (2026–2035). Transmission expansion and renewable generation interconnections support HV and distribution-level procurement. The market also benefits from industrial demand associated with mining, data infrastructure, and independent power projects.
Middle East & Africa Instrument Transformer Market Analysis
Middle East & Africa generated USD 415 million in 2025 and is projected to grow at a 7.00% CAGR (2026–2035). The region's growth is supported by Gulf power-infrastructure investment, renewable capacity additions, industrial-city development, and grid-extension needs. Demand is concentrated in utility-scale projects, where suppliers must combine technical qualification with the ability to support complex delivery requirements.
Saudi Arabia
Saudi Arabia generated USD 91 million in 2025 and is projected to grow at a 7.4% CAGR (2026–2035). Transmission and distribution expansion, renewable-energy development, and large-scale infrastructure projects are broadening demand for HV and EHV equipment. Projects associated with economic diversification require dependable protection and metering systems at new generation and interconnection points.
UAE
The UAE is projected to generate USD 118 million by 2035 and represented 14.0% of MEA revenue in 2025. Grid modernization, major solar installations, nuclear-related infrastructure, and data-center development sustain equipment demand. Procurement emphasizes reliable operation, compact substation design, and suppliers capable of supporting technically complex projects.
South Africa
South Africa represented 13.0% of MEA revenue in 2025 and is projected to grow at a 6.2% CAGR (2026–2035). Substation rehabilitation and independent-power-project additions support replacement and greenfield demand. Local technical capability and domestic-content considerations influence supplier selection, particularly in utility procurement programs.
GMI Analyst View
We believe regional performance will remain split between mature markets driven by replacement and protection modernization and growth markets building new substation capacity. Suppliers that can balance legacy-system compatibility with digital, high-voltage, and lower-emission product platforms will be best placed to serve both demand profiles.
The Instrument Transformer Market remains fragmented, with the top five suppliers collectively accounting for approximately 24.4% of global revenue in 2025. Instrument Transformer Market share is shaped by high-voltage certification, manufacturing capacity, installed-base relationships, digital-substation integration, and the ability to meet utility and EPC qualification requirements across diverse regulatory markets.
Hitachi Energy held a 7.7% market share in 2025. Its competitive position is supported by a broad HV, EHV, and UHV portfolio, global utility relationships, and investment in manufacturing capacity. The company's U.S. grid-infrastructure investment program reflects an effort to address rising demand for critical power equipment [5].
Siemens Energy held a 6.8% market share in 2025. The company is positioned in high-voltage and gas-insulated applications and benefits from its broader protection, switchgear, and digital-substation capabilities. Its development of SF6-alternative technologies is relevant to European utility procurement as environmental requirements reshape equipment selection.
ABB held a 3.6% market share in 2025. Its position is reinforced by a portfolio spanning conventional and digital instrument transformers, with participation across utility, industrial, transportation, and power-management applications. IEC 61850-compatible solutions support its role in projects where protection and measurement architectures are being modernized.
GE Vernova competes through its North American utility relationships, grid-solutions portfolio, and growing domestic manufacturing footprint. Its ability to bundle protection, switchgear, and related grid equipment can strengthen access to complex substation projects, especially where utilities seek integrated supply arrangements.
Mitsubishi Electric maintains a strong presence in Japan and the broader Asia Pacific region through its transformer manufacturing capabilities, high-voltage testing infrastructure, and established utility relationships. Its market position is supported by demand for reliable equipment in technically demanding grid applications.
Specialist suppliers, including Arteche, PFIFFNER, Ritz Instruments Transformers, Trench Group, KONČAR, CG Power and Industrial Solutions, and Nissin Electric, compete where precision measurement, high-voltage engineering, regional certification, or application-specific design creates differentiation. Regional manufacturers also retain meaningful positions in distribution and medium-voltage procurement where local qualification, cost competitiveness, and domestic supply preferences are important.
Recent Industry Developments
Hitachi Energy announced a U.S. manufacturing investment program exceeding USD 1 billion in September 2025 to expand critical grid-infrastructure capacity, including transformer and high-voltage component production.
Trench Group announced long-term framework agreements in May 2025 with GE Vernova, Hitachi Energy, and Siemens Energy covering high-voltage grid components, including instrument transformers [6].
GE Vernova announced investment of approximately USD 20 million in December 2025 to expand grid-solutions manufacturing capacity, including at its Clearwater, Florida facility that produces instrument transformers.
Need a specific section of this report?
Purchase regional analysis, country-level analysis, company profiles, or any other segment-level insights separately
based on your research needs.
Authors: Ankit Gupta, Riya Gupta
Instrument Transformer Market Scope
Instrument Transformer Market Size
Instrument Transformer Market Trends
Instrument Transformer Market Analysis
Instrument Transformer Market Share
Report Content
Chapter 1. Methodology & Scope
1.1 Research approach
1.2 Quality commitment
1.2.1 GMI AI policy & data integrity commitment
1.2.1.1 Source consistency protocol
1.3 Research trail & confidence scoring
1.3.1 Research trail components
1.3.2 Scoring components
1.4 Data collection
1.4.1 Partial list of primary sources
1.5 Data mining sources
1.5.1 Paid sources
1.5.1.1 Sources, by region
1.6 Base estimates and calculations
1.6.1 Base year calculation for any one approach
1.7 Forecast model
1.7.1 Quantified market impact analysis
1.7.1.1 Mathematical impact of growth parameters on forecast
1.8 Research transparency addendum
1.8.1 Source attribution framework
1.8.2 Quality assurance metrics
1.8.3 Our commitment to trust
1.9 Market definitions
Chapter 2. Executive Summary
2.1 Industry synopsis, 2022 - 2035
2.1.1 Business trends
2.1.2 Product type trends
2.1.3 Application trends
2.1.4 Voltage rating trends
2.1.5 Insulation type trends
2.1.6 Winding type trends
2.1.7 Regional trends
Chapter 3. Industry Insights
3.1 Industry ecosystem analysis
3.1.1 Raw material availability & sourcing analysis
3.1.2 Manufacturing capacity assessment
3.1.3 Supply chain resilience & risk factors
3.1.4 Distribution network analysis
3.2 Industry impact forces
3.2.1 Growth drivers
3.2.2 Industry pitfalls & challenges
3.3 Growth potential analysis
3.4 Technology and innovation landscape
3.5 Regulatory landscape
3.6 Porter's analysis
3.6.1 Bargaining power of suppliers
3.6.2 Bargaining power of buyers
3.6.3 Threat of new entrants
3.6.4 Threat of substitutes
3.7 PESTEL analysis
3.7.1 Political factors
3.7.2 Economic factors
3.7.3 Social factors
3.7.4 Technological factors
3.7.5 Legal factors
3.7.6 Environmental factors
3.8 Emerging opportunities & trends
3.9 Digitalization & IoT integration
3.10 Investment analysis & future outlook
Chapter 4. Competitive Landscape, 2026
4.1 Introduction
4.2 Company market share analysis, 2025
4.2.1 North America
4.2.2 Europe
4.2.3 Asia Pacific
4.2.4 Middle East & Africa
4.2.5 Latin America
4.3 Competitive analysis of major market players
4.4 Competitive positioning matrix
4.5 Key developments
4.5.1 Mergers & acquisitions
4.5.2 Partnerships & collaborations
4.5.3 New product launches
4.5.4 Expansion plans & funding
4.6 Company tier benchmarking
4.6.1 Tier classification criteria & qualifying thresholds
4.6.2 Tier positioning matrix by revenue, geography & innovation
Chapter 5. Market Estimates and Forecast, By Product Type, 2022 – 2035 (USD Million)
5.1 Key trends
5.2 Current Transformer (CT)
5.3 Voltage Transformer (VT/CVT)
Chapter 6. Market Estimates and Forecast, By Application, 2022 – 2035 (USD Million)
6.1 Key trends
6.2 Utility
6.3 Industrial
6.4 Commercial
Chapter 7. Market Size and Forecast, By Voltage Rating, 2022 - 2035 (USD Million)
7.1 Key trends
7.2 < 11 kV
7.3 11 – 33 kV
7.4 33 – 66 kV
7.5 66 – 220 kV
7.6 220 – 800 kV
7.7 > 800 kV
Chapter 8. Market Size and Forecast, By Insulation Type, 2022 - 2035 (USD Million)
8.1 Key trends
8.2 Oil-Immersed
8.3 SF6 Gas-Insulated
8.4 Solid
8.5 Air
8.6 Others
Chapter 9. Market Size and Forecast, By Winding Type, 2022 - 2035 (USD Million)
9.1 Key trends
9.2 Two-Winding
9.3 Auto-wound
Chapter 10. Market Size and Forecast, By Regions, 2022 – 2035 (USD Million)
10.1 Key trends
10.2 North America
10.2.1 U.S.
10.2.2 Canada
10.2.3 Mexico
10.3 Europe
10.3.1 UK
10.3.2 Germany
10.3.3 France
10.3.4 Spain
10.3.5 Italy
10.4 Asia Pacific
10.4.1 China
10.4.2 Australia
10.4.3 India
10.4.4 Japan
10.4.5 South Korea
10.5 Middle East & Africa
10.5.1 Saudi Arabia
10.5.2 UAE
10.5.3 South Africa
10.6 Latin America
10.6.1 Brazil
10.6.2 Argentina
Chapter 11. Company Profiles
Don't see your key competitors?
The companies listed in this report are a curated selection - not the full competitive universe.
Our market revenue calculations use a bottom-up methodology that accounts for all players across all regions - including manufacturers, distributors, and specialists not individually profiled. The profiles section spotlights strategically significant players; it does not define the scope of our market sizing.
Your competitive landscape may also include
Regional or domestic-only leaders not in the global top tier
Distributors and channel partners who control market access
Emerging disruptors, startups, or adjacent-industry entrants
Niche players focused on a specific application or end-use
Free customization - up to 20% of report value
Need specific data? Request customization and get the insights tailored to your exact requirements.
For inquiries regarding discounts, bulk purchases, or customization requests, please contact us at[email protected]
Over 70% of our clients customize reports to fit their needs. Please tell us how you would like to customize yours below
Share Content
Add Citations
Ankit Gupta. 2026, September. Instrument Transformer Market Size - By Product, By Winding, By Cooling, By Insulation, By Rating, By Application Analysis, Share, Growth Forecast 2025 – 2034 (Report ID: GMI2141). Global Market Insights Inc. Retrieved November 11, 2026, from https://www.gminsights.com/toc/details/instrument-transformer-market
Instrument Transformer Market
Get a free sample of this report
Get a free sample of this report Instrument Transformer Market
Is your requirement urgent? Please give us your business email for a speedy delivery!



Instrument Transformer Market Size
The Instrument Transformer Market was valued at USD 8.30 billion in 2025, is projected to reach USD 8.84 billion in 2026, and is expected to grow at a 5.83% CAGR (2026–2035) to reach USD 14.72 billion by 2035. The market comprises current transformers (CTs) and voltage, potential, and capacitive voltage transformers used to provide isolated measurements for protection, revenue metering, and energy monitoring across transmission and distribution systems.
Market expansion is being shaped by the replacement of aging substation equipment alongside greenfield transmission capacity required for renewable integration and expanding electricity loads. Procurement is increasingly weighted toward higher-accuracy, digital-ready equipment, raising revenue intensity even where project delivery schedules constrain the pace of equipment commissioning.
GMI Analyst View
Based on our discussions with procurement executives across major utilities and substation project developers, global instrument transformer shipments reached approximately 3,375 thousand units in 2025. The shipment profile indicates that utilities are specifying more technically demanding equipment for grid-critical positions, supporting revenue expansion through a richer mix of higher-voltage and higher-accuracy products.
Instrument Transformer Market Trends, Growth Drivers & GMI Forecast Outlook
Grid investment commitments are broadening the addressable equipment pipeline, but project permitting, supply-chain lead times, and insulation redesign requirements will determine how quickly commitments convert into installed substation capacity. The forecast reflects a transition toward digitally compatible, higher-voltage, and lower-emission product configurations.
Key Drivers
*Evidence anchors use cited external data; demand implications and forecast conditions represent GMI analysis.*
Grid capital programs create demand at several points in the equipment cycle: new lines require protection and metering at terminal substations, while upgraded bays require replacement measurement equipment compatible with contemporary relay architectures. Supply constraints for transformers and cables mean manufacturers with qualified capacity can convert framework agreements into durable order visibility, even when installation schedules move unevenly across markets.
China's grid program is particularly consequential because UHV corridors, backbone-network reinforcement, and distribution automation require different transformer configurations within the same investment cycle. UHV projects favor specialized high-voltage equipment, while urban and regional network upgrades create broader CT and VT demand across feeder protection and revenue-metering positions.
Digital substations change the commercial logic from stand-alone device procurement toward systems compatibility. Utilities replacing analog relay environments increasingly evaluate accuracy class, process-bus connectivity, communications integration, and long-term certification together, increasing the importance of engineering depth and installed-base service capability.
Key Restraints
Tight supply chains for transformers and cables, and lengthy permitting processes, constrain the pace at which grid investment translates into commissioned equipment; grid infrastructure typically takes 5–15 years to plan, permit, and complete.
*Evidence anchors use cited external data; demand implications and forecast conditions represent GMI analysis.*
The investment gap is not uniform across the market. Utilities with credible cost-recovery mechanisms can sustain renewal programs, whereas financially constrained distribution operators may defer network expansion and prioritize maintenance over new capacity. That divergence limits near-term demand conversion in lower-voltage applications, particularly where public funding and utility creditworthiness remain uncertain.
The EU's F-Gas framework is creating a more immediate redesign challenge for suppliers of gas-insulated systems. The regulation changes equipment-selection criteria for new switchgear installations and pushes manufacturers to qualify solid-insulated and alternative-gas configurations while customers assess lifecycle performance, footprint, and compatibility with existing substation layouts.
Long project-development timelines also delay final equipment specifications. Instrument transformer suppliers may receive early indications of demand through framework agreements and EPC engagement, yet revenue recognition depends on permitting, construction sequencing, and the availability of related grid equipment. Tight transformer and cable supply chains compound this timing risk [2].
GMI Analyst View
We view the market's central tension as execution rather than demand creation. Grid programs are expanding the equipment pipeline, but the suppliers best positioned to benefit will be those that can meet technical qualification requirements, manage long lead-time components, and offer compliant alternatives as procurement standards evolve.
Instrument Transformer Market Segment Analysis
By Product Type
Current transformers generated USD 4.73 billion in revenue in 2025 and are projected to generate USD 8.68 billion by 2035. Current transformers benefit from their essential role in feeder protection, bus protection, transformer-bay monitoring, and revenue metering. Renewable-connected substations require more measurement points and tighter protection coordination, strengthening demand for high-accuracy and digitally integrated CT configurations.
Voltage transformers and capacitive voltage transformers generated USD 3.56 billion in 2025 and are expected to hold a 41.0% share in 2035. VT and CVT demand remains closely associated with transmission-level voltage measurement, bus protection, and high-voltage metering. Their role in EHV and UHV stations preserves a technically demanding addressable market, although expanding current-measurement requirements in modern protection schemes moderate their relative mix position.
By Application
Utility applications generated USD 5.56 billion in 2025 and are expected to represent 70.0% of the market in 2035. Utilities procure instrument transformers through long-cycle grid renewal, transmission expansion, and digital-substation programs. Their preference for certified suppliers, repeatable platform designs, and framework procurement gives established vendors greater visibility than project-by-project commercial demand.
Industrial applications are projected to generate USD 2.79 billion by 2035 and represented 20.0% of the market in 2025. Industrial demand is concentrated in energy-intensive facilities where electrical protection, process continuity, and billing-quality measurement are operational requirements. Petrochemicals, mining, steel, and large data-center campuses provide demand for equipment that can operate reliably under site-specific load, environmental, and safety conditions.
Commercial applications represented 13.0% of the market in 2025 and are expected to grow at a 3.89% CAGR (2026–2035). Commercial installations typically require lower-voltage equipment with less demanding measurement and protection specifications than utility or industrial sites. Growth remains supported by urban power infrastructure, but pricing pressure and embedded metering alternatives limit revenue intensity.
By Voltage Rating
The <11 kV segment represented 10.0% of the market in 2025 and is projected to expand at a 3.24% CAGR (2026–2035). Low-voltage applications are influenced by distribution modernization and commercial electrical installations, but standardized specifications and broad supplier availability make this category more exposed to pricing competition than higher-voltage classes.
The 11–33 kV segment generated USD 2.40 billion in 2025 and is expected to hold a 27.0% share in 2035. Medium-voltage equipment serves a wide installed base spanning distribution substations, industrial switchgear, and commercial metering. Demand is geographically diverse, although higher-voltage equipment is expected to gain relative importance as transmission investment accelerates.
The 33–66 kV segment is projected to generate USD 2.35 billion by 2035 and represented 17.0% of the market in 2025. Sub-high-voltage systems connect primary distribution networks with the transmission system. Investment in regional substations, distributed generation interconnections, and network reinforcement sustains demand, particularly where grid operators are addressing load growth outside major urban centers.
The 66–220 kV segment generated USD 1.82 billion in 2025 and is expected to grow at a 6.35% CAGR (2026–2035). High-voltage equipment benefits from replacement programs and the construction of new transmission substations. The category commands higher engineering and qualification requirements because protection failures at these voltage levels carry larger system-reliability consequences.
The 220–800 kV segment is projected to generate USD 2.50 billion by 2035 and represented 15.0% of the market in 2025. EHV demand is tied to large-scale renewable integration, interregional transmission, and long-distance power-transfer projects. Suppliers must combine high-voltage design expertise with factory testing capability and utility-specific certifications, raising the barriers to entry.
The >800 kV segment is expected to represent 9.0% of the market in 2035 and grow at an 8.82% CAGR (2026–2035). UHV deployment is concentrated in systems that move power across long distances between generation and load centers. The segment's growth is driven less by broad-based replacement demand than by a limited number of technically intensive corridor and converter-station projects.
By Insulation Type
Oil-immersed instrument transformers generated USD 3.98 billion in 2025 and are expected to represent 42.0% of the market in 2035. Oil-immersed designs retain a strong position in outdoor HV and EHV substations because of their established service record, thermal performance, and suitability for demanding climate conditions. Their mature supply base also supports continued use in refurbishment and replacement projects.
SF6 gas-insulated instrument transformers generated USD 2.32 billion in 2025 and are expected to grow at a 5.41% CAGR (2026–2035). Gas-insulated products remain important in space-constrained installations, particularly where equipment must integrate with GIS platforms. However, the European regulatory shift toward SF6-free switchgear is accelerating qualification work for alternative designs and changing utility specifications for new installations.
Solid cast-resin and epoxy instrument transformers are projected to generate USD 3.09 billion by 2035 and grow at a 9.08% CAGR (2026–2035). Solid-insulated products are gaining relevance where operators seek lower-maintenance, environmentally compatible, and digitally adaptable equipment. Their performance in indoor and constrained installations is expanding their role as utilities and EPCs reconsider insulation choices for new medium-voltage projects.
Air-core instrument transformers represented 6.0% of the market in 2025 and are projected to grow at a 7.67% CAGR (2026–2035). Air-core designs address applications where linearity, saturation resistance, and compatibility with electronic measurement systems are especially valuable. Their use in digital protection platforms supports a differentiated role despite their narrower installed base.
Other insulation types, including eco-gas and vacuum solutions, are expected to represent 3.0% of the market in 2035 and grow at a 10.70% CAGR (2026–2035). Alternative insulation technologies are benefiting from regulatory and customer pressure to reduce reliance on fluorinated gases. Commercial success will depend on field validation, standards compliance, supply availability, and the ability to meet utility reliability expectations across voltage classes.
By Winding Type
Two-winding instrument transformers generated USD 6.47 billion in 2025 and are expected to account for 76.0% of the market in 2035. Two-winding designs remain the default across conventional metering and protection applications because they are broadly certified, compatible with installed relay systems, and supported by an established manufacturing ecosystem.
Auto-wound instrument transformers are projected to generate USD 3.53 billion by 2035 and grow at a 6.86% CAGR (2026–2035). Auto-wound configurations can offer footprint and material-efficiency benefits in selected high-current and space-constrained applications. Their adoption is advancing where substation engineering priorities favor compact layouts and application-specific optimization.
GMI Analyst View
We see segment performance increasingly determined by specification intensity rather than unit volume alone. Utility-led investment, digital protection requirements, and insulation substitution are shifting competitive advantage toward suppliers that can combine certified high-voltage designs, systems integration, and repeatable manufacturing quality.
Instrument Transformer Market Regional Analysis
North America Instrument Transformer Market Analysis
North America generated USD 1.45 billion in 2025 and is expected to grow at a 5.16% CAGR (2026–2035). The Instrument Transformer Market in North America is anchored by the replacement of aging substation assets, renewable interconnection projects, grid-hardening requirements, and expanding large-load connections. Procurement is typically governed by utility standards, long planning cycles, and rigorous product qualification, favoring suppliers with established service and testing capabilities.
United States
The United States generated USD 1.24 billion in 2025 and is projected to grow at a 5.3% CAGR (2026–2035). Transmission development, substation automation, and large industrial and data-center interconnections are broadening demand for high-voltage measurement and protection equipment. Supply shortages in U.S. grid equipment have also reinforced the strategic value of local manufacturing capacity and dependable delivery performance [7].
Canada
Canada represented 11.0% of North American revenue in 2025 and is projected to generate USD 240 million by 2035. Hydroelectric interconnections, renewable development, and provincial grid reinforcement programs support demand across HV and EHV applications. Utility investment is concentrated in projects that improve regional transfer capacity and strengthen the resilience of aging networks.
Europe Instrument Transformer Market Analysis
Europe represented 19.0% of the market in 2025 and is projected to generate USD 2.67 billion by 2035. European demand is shaped by cross-border transmission reinforcement, renewable integration, and the replacement of legacy substation equipment. The F-Gas regulatory framework is also altering equipment selection by accelerating demand for SF6-free configurations in relevant new switchgear projects.
Germany
Germany generated USD 332 million in 2025 and is projected to grow at a 5.8% CAGR (2026–2035). North-to-south power corridors and offshore-wind interconnection are creating concentrated demand for HV and EHV substation equipment. Distribution modernization adds a separate demand stream for compliant medium-voltage products as operators update urban and industrial networks.
United Kingdom
The United Kingdom represented 12.0% of European revenue in 2025 and is projected to generate USD 322 million by 2035. Offshore wind connections, transmission reinforcement, and interconnector development sustain demand for protection and metering equipment. The market favors suppliers able to meet utility-specific qualification requirements across conventional and digital-substation applications.
France
France is projected to generate USD 370 million by 2035 and represented 14.0% of European revenue in 2025. Transmission investment supporting nuclear, offshore wind, and network reinforcement provides demand across high-voltage systems. Distribution modernization also supports CT and VT procurement for feeder automation, measurement, and grid-management functions.
Asia Pacific Instrument Transformer Market Analysis
Asia Pacific represented 53.0% of the market in 2025 and is projected to generate USD 8.01 billion by 2035. The Instrument Transformer Market in Asia Pacific is defined by a combination of large-scale grid construction, rapidly expanding renewable capacity, distribution modernization, and concentrated investment in high-voltage transmission. China and India are central to regional demand, while Japan and South Korea provide technically sophisticated replacement and upgrade markets.
China
China generated USD 2.91 billion in 2025 and is projected to grow at a 6.1% CAGR (2026–2035). China's demand is underpinned by SGCC investment in UHV corridors, transmission reinforcement, and intelligent distribution networks. Domestic manufacturers are well positioned in volume procurement, while suppliers with specialized UHV certifications retain opportunities in technically demanding projects.
India
India generated USD 623 million in 2025 and is projected to grow at an 8.7% CAGR (2026–2035). Transmission expansion, distribution reform, smart-metering deployment, and renewable-generation interconnection are creating demand across multiple voltage classes. The breadth of these programs supports both standardized distribution equipment and higher-specification products for new transmission substations.
Japan
Japan is projected to generate USD 319 million by 2035 and grow at a 2.0% CAGR (2026–2035). Japan's market is primarily replacement-led, reflecting a mature installed base and tightly regulated utility procurement. Demand remains technically sophisticated because resilience, reliability, and compatibility with established substation standards are central purchasing considerations.
South Korea
South Korea represented 5.0% of Asia Pacific revenue in 2025 and is projected to generate USD 381 million by 2035. Transmission reinforcement, offshore wind interconnection, and new industrial-power requirements support investment in substation equipment. Domestic manufacturing capability and utility procurement practices influence competitive access, particularly in higher-voltage applications.
Latin America Instrument Transformer Market Analysis
Latin America is projected to generate USD 803 million by 2035 and grow at a 5.79% CAGR (2026–2035). Regional demand is led by Brazil and is supported by renewable interconnections, hydroelectric capacity, mining, and expanding urban electricity consumption. Investment conversion remains sensitive to utility finances and macroeconomic conditions, creating a more uneven project pipeline than in larger developed markets.
Brazil
Brazil generated USD 205 million in 2025 and is projected to grow at a 5.9% CAGR (2026–2035). Transmission expansion and renewable generation interconnections support HV and distribution-level procurement. The market also benefits from industrial demand associated with mining, data infrastructure, and independent power projects.
Middle East & Africa Instrument Transformer Market Analysis
Middle East & Africa generated USD 415 million in 2025 and is projected to grow at a 7.00% CAGR (2026–2035). The region's growth is supported by Gulf power-infrastructure investment, renewable capacity additions, industrial-city development, and grid-extension needs. Demand is concentrated in utility-scale projects, where suppliers must combine technical qualification with the ability to support complex delivery requirements.
Saudi Arabia
Saudi Arabia generated USD 91 million in 2025 and is projected to grow at a 7.4% CAGR (2026–2035). Transmission and distribution expansion, renewable-energy development, and large-scale infrastructure projects are broadening demand for HV and EHV equipment. Projects associated with economic diversification require dependable protection and metering systems at new generation and interconnection points.
UAE
The UAE is projected to generate USD 118 million by 2035 and represented 14.0% of MEA revenue in 2025. Grid modernization, major solar installations, nuclear-related infrastructure, and data-center development sustain equipment demand. Procurement emphasizes reliable operation, compact substation design, and suppliers capable of supporting technically complex projects.
South Africa
South Africa represented 13.0% of MEA revenue in 2025 and is projected to grow at a 6.2% CAGR (2026–2035). Substation rehabilitation and independent-power-project additions support replacement and greenfield demand. Local technical capability and domestic-content considerations influence supplier selection, particularly in utility procurement programs.
GMI Analyst View
We believe regional performance will remain split between mature markets driven by replacement and protection modernization and growth markets building new substation capacity. Suppliers that can balance legacy-system compatibility with digital, high-voltage, and lower-emission product platforms will be best placed to serve both demand profiles.
Instrument Transformer Market Share & Competitive Landscape
The Instrument Transformer Market remains fragmented, with the top five suppliers collectively accounting for approximately 24.4% of global revenue in 2025. Instrument Transformer Market share is shaped by high-voltage certification, manufacturing capacity, installed-base relationships, digital-substation integration, and the ability to meet utility and EPC qualification requirements across diverse regulatory markets.
Hitachi Energy held a 7.7% market share in 2025. Its competitive position is supported by a broad HV, EHV, and UHV portfolio, global utility relationships, and investment in manufacturing capacity. The company's U.S. grid-infrastructure investment program reflects an effort to address rising demand for critical power equipment [5].
Siemens Energy held a 6.8% market share in 2025. The company is positioned in high-voltage and gas-insulated applications and benefits from its broader protection, switchgear, and digital-substation capabilities. Its development of SF6-alternative technologies is relevant to European utility procurement as environmental requirements reshape equipment selection.
ABB held a 3.6% market share in 2025. Its position is reinforced by a portfolio spanning conventional and digital instrument transformers, with participation across utility, industrial, transportation, and power-management applications. IEC 61850-compatible solutions support its role in projects where protection and measurement architectures are being modernized.
GE Vernova competes through its North American utility relationships, grid-solutions portfolio, and growing domestic manufacturing footprint. Its ability to bundle protection, switchgear, and related grid equipment can strengthen access to complex substation projects, especially where utilities seek integrated supply arrangements.
Mitsubishi Electric maintains a strong presence in Japan and the broader Asia Pacific region through its transformer manufacturing capabilities, high-voltage testing infrastructure, and established utility relationships. Its market position is supported by demand for reliable equipment in technically demanding grid applications.
Specialist suppliers, including Arteche, PFIFFNER, Ritz Instruments Transformers, Trench Group, KONČAR, CG Power and Industrial Solutions, and Nissin Electric, compete where precision measurement, high-voltage engineering, regional certification, or application-specific design creates differentiation. Regional manufacturers also retain meaningful positions in distribution and medium-voltage procurement where local qualification, cost competitiveness, and domestic supply preferences are important.
Recent Industry Developments
Hitachi Energy announced a U.S. manufacturing investment program exceeding USD 1 billion in September 2025 to expand critical grid-infrastructure capacity, including transformer and high-voltage component production.
Trench Group announced long-term framework agreements in May 2025 with GE Vernova, Hitachi Energy, and Siemens Energy covering high-voltage grid components, including instrument transformers [6].
GE Vernova announced investment of approximately USD 20 million in December 2025 to expand grid-solutions manufacturing capacity, including at its Clearwater, Florida facility that produces instrument transformers.
Need a specific section of this report?
Purchase regional analysis, country-level analysis, company profiles, or any other segment-level insights separately
based on your research needs.