
Escalators and Moving Walkways Market Size & Share 2026-2035
Download Free PDF
Report Content
Chapter 1. Research Methodology
1.1 Research approach
1.2 Quality Commitments
1.2.1 GMI AI policy & data integrity commitment
1.2.1.1 Source consistency protocol
1.3 Research Trail & Confidence Scoring
1.3.1 Research Trail Components
1.3.2 Scoring Components
1.4 Data Collection
1.4.1 Partial list of primary sources
1.5 Data mining sources
1.5.1 Paid sources
1.5.1.1 Sources, by region
1.6 Base estimates and calculations
1.6.1 Base year calculation
1.7 Forecast model
1.7.1 Quantified market impact analysis
1.7.1.1 Mathematical impact of growth parameters on forecast
1.8 Research transparency addendum
1.8.1 Source attribution framework
1.8.2 Quality assurance metrics
1.8.3 Our commitment to trust
Chapter 2. Executive Summary
2.1 Industry 360° synopsis
2.2 Key market trends
2.2.1 Product type trends
2.2.2 Business type trends
2.2.3 Installation setting trends
2.2.4 Application trends
2.2.5 Regional trends
2.3 TAM Analysis, 2027–2035
2.4 CXO perspectives: strategic imperatives
Chapter 3. Industry Insights
3.1 Industry ecosystem analysis
3.1.1 Supplier Landscape
3.1.2 Profit Margin
3.1.3 Cost structure
3.1.4 Value addition at each stage
3.1.5 Factors affecting the value chain
3.1.6 Disruptions
3.2 Industry impact forces
3.2.1 Growth drivers
3.2.1.1 Rapid urbanization & smart city infrastructure investments fueling demand
3.2.1.2 Global expansion of transportation hubs (airports, metro & rail networks)
3.2.1.3 Rising commercial real estate development & mixed-use construction activity
3.2.2 Industry pitfalls and challenges
3.2.2.1 High capital investment & installation costs limiting adoption in budget-sensitive markets
3.2.2.2 Maintenance complexity, operational downtime & lifecycle cost concerns
3.2.3 Market opportunities
3.2.3.1 Smart escalator technology adoption - predictive maintenance & AI traffic optimization
3.2.3.2 Growing demand for energy-efficient & green-certified escalator systems
3.3 Growth potential analysis
3.4 Pricing Analysis (Driven by Primary Research)
3.4.1 Historical Price Trend Analysis
3.4.2 Pricing Strategy by Player Type (Premium / Value / Cost-plus)
3.5 Regulatory landscape
3.5.1 North America
3.5.2 Europe
3.5.3 Asia-Pacific
3.5.4 Latin America
3.5.5 Middle East and Africa
3.6 Porter's analysis
3.7 PESTEL analysis
3.8 Trade Data Analysis (Based on Paid Database)
3.8.1 Import/Export Volume & Value Trends
3.8.2 Key Trade Corridors & Tariff Impact
3.9 Impact of AI & Generative AI on the Market (Driven by Primary Research)
3.9.1 AI-Driven Disruption of Existing Business Models
3.9.2 GenAI Use Cases & Adoption Roadmap by Segment
3.9.3 Risks, Limitations & Regulatory Considerations
3.10 Technology & Innovation Landscape
3.10.1 Smart escalator & IoT-enabled monitoring systems
3.10.2 Energy-efficient drive technologies
3.10.3 Modular & prefabricated design innovations for faster deployment
3.10.4 Remote diagnostics & predictive maintenance technologies
3.11 Patent Landscape (Driven by Primary Research)
3.12 Capacity & Production Landscape (Driven by Primary Research)
3.12.1 Installed manufacturing capacity by region & key producer
3.12.2 Capacity utilization rates & expansion pipelines
Chapter 4. Competitive Landscape, 2025
4.1 Introduction
4.2 Company market share analysis
4.2.1 By Region
4.2.1.1 North America
4.2.1.2 Europe
4.2.1.3 Asia-Pacific
4.2.1.4 Latin America
4.2.1.5 Middle East and Africa
4.2.2 Market Concentration Analysis
4.3 Competitive analysis of major market players
4.4 Competitive positioning matrix
4.5 Key developments
4.5.1 Mergers & acquisitions
4.5.2 Partnerships & collaborations
4.5.3 New product launches
4.5.4 Expansion plans and funding
4.6 Company tier benchmarking
4.6.1 Tier classification criteria & qualifying thresholds
4.6.2 Tier positioning matrix by revenue, geography & innovation
Chapter 5. Market Estimates & Forecast, By Product Type, 2022-2035 (USD Billion, Units)
5.1 Key trends
5.2 Escalators
5.2.1 Parallel Escalators
5.2.2 Multi-Parallel Escalators
5.2.3 Crisscross Escalators
5.2.4 Specialty Escalators (Spiral/Curved & Accessibility-Configured)
5.3 Moving Walkways
5.3.1 Horizontal (Flat) Moving Walkways
5.3.2 Inclined Moving Walkways
Chapter 6. Market Estimates & Forecast, By Business Type, 2022-2035 (USD Billion, Units)
6.1 Key trends
6.2 New Equipment/Installation
6.3 Maintenance & Repair
6.3.1 Spare parts & component supply
6.4 Modernization
Chapter 7. Market Estimates & Forecast, By Installation Setting, 2022-2035 (USD Billion, Units)
7.1 Key trends
7.2 Indoor
7.3 Outdoor
Chapter 8. Market Estimates & Forecast, By Application, 2022-2035 (USD Billion, Units)
8.1 Key trends
8.2 Public Transit
8.3 Airports
8.4 Retail
8.5 Institutional
8.6 Others (Hotels & hospitality venues, Office complexes & corporate campuses)
Chapter 9. Market Estimates & Forecast, By Region, 2022-2035 (USD Billion, Units)
9.1 Key trends
9.2 North America
9.2.1 U.S.
9.2.2 Canada
9.3 Europe
9.3.1 Germany
9.3.2 U.K.
9.3.3 France
9.3.4 Italy
9.3.5 Spain
9.3.6 Rest of Europe
9.4 Asia Pacific
9.4.1 China
9.4.2 Japan
9.4.3 India
9.4.4 South Korea
9.4.5 Australia
9.4.6 Rest of Asia Pacific
9.5 Latin America
9.5.1 Mexico
9.5.2 Brazil
9.5.3 Argentina
9.5.4 Rest of Latin America
9.6 Middle East & Africa
9.6.1 UAE
9.6.2 Saudi Arabia
9.6.3 South Africa
9.6.4 Rest of Middle East & Africa
Chapter 10. Company Profiles
Don't see your key competitors?
The companies listed in this report are a curated selection - not the full competitive universe.
Our market revenue calculations use a bottom-up methodology that accounts for all players across all regions - including manufacturers, distributors, and specialists not individually profiled. The profiles section spotlights strategically significant players; it does not define the scope of our market sizing.
Your competitive landscape may also include
Free customization - up to 20% of report value
Need specific data? Request customization and get the insights tailored to your exact requirements.
For inquiries regarding discounts, bulk purchases, or customization requests, please contact us at [email protected]
Share Content
Add Citations
Avinash Singh. 2026, September. Escalators and Moving Walkways Market (Report ID: GMI2790). Global Market Insights Inc. Retrieved November 13, 2026, from https://www.gminsights.com/toc/details/escalators-and-moving-walkways-market

Escalators and Moving Walkways Market
Get a free sample of this report
Escalators & Moving Walkways Market Size
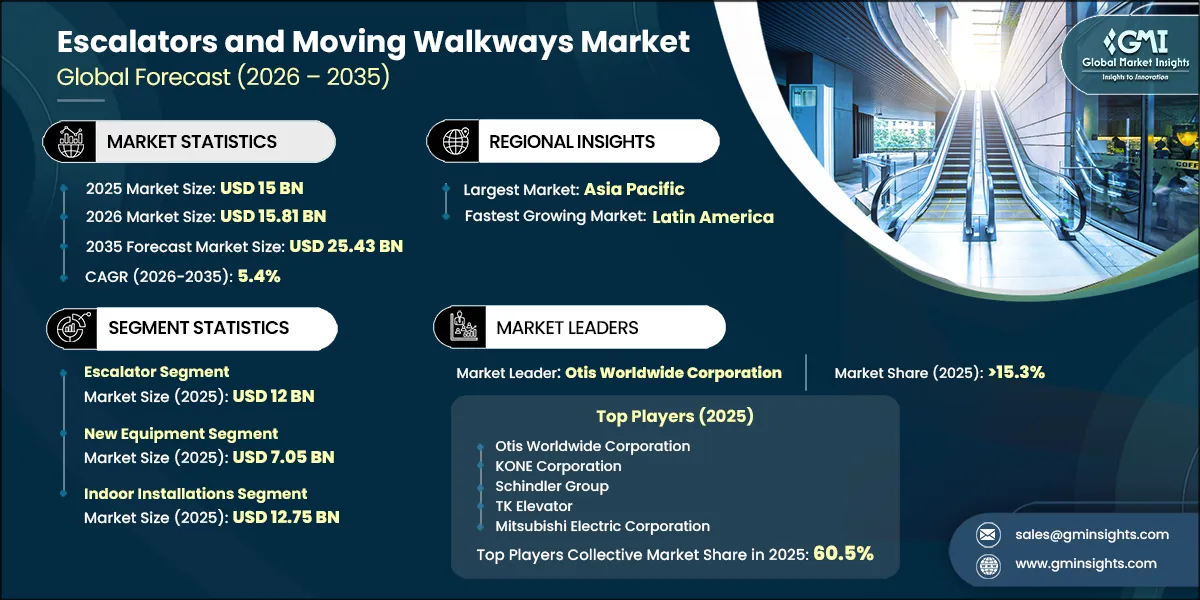
The escalators & moving walkways market was valued at USD 15.00 billion in 2025, is expected to reach USD 15.81 billion in 2026, and is projected to grow at a 5.4% CAGR (2026–2035), reaching USD 25.43 billion by 2035. The market measures demand-side revenue from equipment manufacture, installation, maintenance, and modernization across transit, airport, retail, commercial, and institutional settings.
The market's evolution is being shaped by the interaction of long-cycle public infrastructure programs and a service-intensive installed base. New stations, terminals, and mixed-use developments continue to generate project-led equipment demand, while connected monitoring, safety retrofits, and asset-life extension are increasing the commercial importance of recurring maintenance and modernization work.
GMI Analyst View
Our discussions with industry experts indicate that global escalator and moving walkway revenue reached USD 14.81 billion in 2024. We view the subsequent recovery as evidence that project timing and infrastructure approvals can defer recognition without undermining the underlying procurement pipeline, particularly where transit and terminal projects require equipment at commissioning.
Escalators & Moving Walkways Market Trends, Growth Drivers & GMI Forecast Outlook
Infrastructure-led installation demand is broadening the equipment base that will require decades of service, while digital diagnostics and tighter specifications are changing the revenue mix toward higher-value lifecycle work. The outlook depends on continued transit and airport capital formation, alongside asset owners' ability to fund modernization obligations.
Key Drivers
Evidence anchors use cited external data; demand implications and forecast conditions represent GMI analysis.
Metro systems create equipment demand at the point of station design, not as a discretionary post-construction enhancement. The global metro network exceeded 22,400 km at the end of 2023, illustrating the scale of the addressable installed environment for equipment replacement, inspection, and service work [1]. Deep platforms, interchange corridors, and high passenger throughput also favor OEMs with the engineering and field-service capacity to support stringent uptime requirements.
Airport investment adds a different demand profile because lengthy passenger corridors increase the relevance of moving walkways alongside escalators. Port Polska's procurement for the new CPK passenger terminal covers more than 500 lifts, escalators, and moving walkways, showing how a single greenfield hub can aggregate equipment demand at meaningful scale [5]. Such projects can extend OEM opportunity beyond installation into commissioning, spares, remote monitoring, and long-duration maintenance.
Connected maintenance changes the value proposition from scheduled repair toward availability management. In high-consequence environments, predictive interventions can reduce disruption while giving equipment suppliers a stronger basis for retaining the service relationship. This favors manufacturers able to combine installed-base access, diagnostics, component availability, and local technician coverage.
Key Restraints
Evidence anchors use cited external data; demand implications and forecast conditions represent GMI analysis.
Capital intensity is especially restrictive where traffic volumes cannot justify premium equipment or where owners face competing building-maintenance needs. Smaller commercial and institutional operators may extend asset life through interim repair rather than commit to comprehensive replacement, increasing the unevenness of equipment demand across end-user classes.
The maturity of equipment in North America and Europe creates a timing challenge for asset owners. When multiple units approach replacement simultaneously, operators must balance downtime exposure, budget cycles, and the operational disruption of major works. This favors phased upgrades and modular modernization solutions, but can defer greenfield-equipment expenditure.
Compliance requirements add a distinct layer of cost because controls, drives, sensing systems, and safety components must be integrated into operational assets. They also create a durable addressable market for suppliers with certified upgrade packages and established service networks.
GMI Analyst View
We see the central market shift as a transition from a construction-led model to a blended model in which infrastructure placements and installed-base economics carry comparable strategic weight. OEMs that turn service access into digitally enabled retention should be better insulated from uneven project cycles than suppliers dependent primarily on new-equipment awards.
Escalators & Moving Walkways Market Segment Analysis
By Product Type
The escalators & moving walkways market's escalator segment generated USD 12.00 billion in 2025 and is projected to represent 78.9% of market revenue in 2035. Escalators remain indispensable in vertical, high-throughput passenger environments, notably rail stations, shopping centers, and multilevel public buildings. Their large installed base also creates a substantial service opportunity, although moving walkways gain relevance where horizontal passenger circulation is the governing design requirement.
Moving walkways are projected to generate USD 5.37 billion by 2035 and expand at a 6.0% CAGR (2026–2035). Airport concourses, inter-terminal links, and large integrated developments support this segment because they prioritize travel distance reduction rather than vertical movement. Its growth profile reflects the increasing integration of passenger-flow equipment into terminal and mobility design.
By Business Type
New Equipment generated USD 7.05 billion in 2025 and is projected to account for 42.1% of business-type revenue in 2035. New-equipment awards remain tied to station openings, terminal programs, and major commercial construction. Competitive bidding, local-content requirements, and project execution capability make installation demand more cyclical and geographically variable than aftermarket revenue.
Maintenance & Services is projected to reach USD 10.20 billion by 2035 and grow at a 6.4% CAGR (2026–2035). Availability commitments in transit and airport environments make maintenance an operational necessity rather than an optional add-on. Connected diagnostics and multiyear contracts strengthen the value of installed-base access, technician networks, and spare-parts responsiveness.
Modernization & Upgrades generated USD 2.40 billion in 2025 and is projected to grow at a 6.9% CAGR (2026–2035). Modernization addresses aging controls, energy performance, safety systems, and reliability without always requiring full equipment replacement. Demand is strongest where asset owners need to manage downtime and compliance exposure within constrained capital programs.
By Installation Setting
Indoor installations generated USD 12.75 billion in 2025 and are projected to represent 85.1% of market revenue in 2035. Enclosed stations, airports, malls, and institutional buildings provide the broadest addressable environment because their passenger-flow designs commonly integrate motorized conveyance. These settings also support planned maintenance because operating conditions and access are more controlled.
Outdoor installations are projected to reach USD 3.83 billion by 2035 and represent a stable 15.0% share through 2035. Outdoor systems serve topographically challenging urban areas, open transit platforms, and public-access infrastructure. Weather resistance, corrosion protection, drainage, and temperature-tolerant components raise specification complexity and place a premium on lifecycle engineering.
By Application
Transit (Metro/Rail) generated USD 5.25 billion in 2025 and is projected to reach USD 9.18 billion by 2035. Transit is the most structurally embedded application because escalators are specified throughout station circulation systems. High utilization and public-service obligations also favor comprehensive maintenance arrangements and timely modernization.
Retail & Commercial is projected to reach USD 6.63 billion by 2035 and grow at a 4.6% CAGR (2026–2035). Demand is concentrated in mixed-use projects, destination retail, and commercial redevelopment rather than routine retail construction. In mature markets, procurement is often more price sensitive and replacement led than in transit or airport settings.
Airports are projected to generate USD 4.08 billion by 2035 and expand at a 6.2% CAGR (2026–2035). Airport operators require equipment that can manage peaks in passenger movement while maintaining accessible circulation over long distances. Terminal expansions and connector projects favor suppliers that can coordinate installation with operational continuity and demanding safety requirements.
Institutional applications generated USD 1.80 billion in 2025 and are projected to reach USD 3.06 billion by 2035. Hospitals, public buildings, and education campuses support demand where accessibility, circulation, and durability are central design considerations. Procurement is typically influenced by public budgets, compliance requirements, and long-term facility-management priorities.
Others represented 10.0% of application revenue in 2025 and are projected to grow at a 5.5% CAGR (2026–2035). Hotels, offices, convention facilities, and corporate campuses create project-specific demand where equipment supports guest circulation, architectural design, and podium connectivity. This category is more sensitive to property-development timing than the transit or institutional segments.
GMI Analyst View
We believe the most consequential segment change is not a rapid displacement of one equipment format by another, but a gradual migration of value toward serviceable, connected, and upgradeable assets. Product capability matters, yet service coverage and modernization execution increasingly determine whether OEMs can convert installed equipment into enduring revenue.
Escalators & Moving Walkways Market Regional Analysis
Asia Pacific Escalators & Moving Walkways Market Analysis
The escalators & moving walkways market in Asia Pacific generated USD 9.60 billion in 2025 and is projected to reach USD 15.81 billion by 2035. The region combines large-scale metro construction, airport investment, dense urban development, and the world's deepest concentration of equipment manufacturing. Its future mix will increasingly depend on the balance between China's maturing new-equipment market and expansion elsewhere in Asia.
China
China generated USD 5.57 billion in 2025 and is projected to grow at a 4.5% CAGR (2026–2035). The market is transitioning from major initial buildouts in leading cities toward service, replacement, and modernization opportunities, while lower-tier urban networks continue to support installation demand. Domestic suppliers intensify price competition in standard equipment.
India
India is projected to reach USD 2.83 billion by 2035 and grow at an 8.0% CAGR (2026–2035). Metro expansion and urban commercial development provide a strong installation pipeline. The opportunity favors suppliers able to meet public-procurement requirements while building local commissioning and service capability.
Japan
Japan generated USD 1.06 billion in 2025 and is projected to grow at a 3.5% CAGR (2026–2035). A mature installed base shifts commercial emphasis toward reliability, accessibility, and renewal work. Established domestic service networks are a meaningful competitive barrier in this market.
South Korea
South Korea is projected to reach USD 941 million by 2035 and grow at a 5.0% CAGR (2026–2035). Station accessibility programs and mixed-use development support demand, while established urban rail infrastructure creates recurring replacement and service needs.
North America Escalators & Moving Walkways Market Analysis
North America generated USD 2.40 billion in 2025 and is projected to grow at a 3.9% CAGR (2026–2035). Market demand is primarily modernization and service led, with airport and transit rehabilitation providing selective installation opportunities. Compliance, procurement complexity, and operational-continuity requirements favor experienced OEMs and specialized contractors.
United States
The United States generated USD 2.04 billion in 2025 and is projected to grow at a 3.9% CAGR (2026–2035). Aging transit systems, airport investment, and accessibility-driven projects sustain demand, but capital-program sequencing can delay awards. Suppliers with robust field coverage are advantaged in operationally sensitive rehabilitation projects.
Canada
Canada is projected to reach USD 540 million by 2035 and represent 15.1% of North American revenue in 2035. Urban transit construction and station upgrades underpin demand, while commercial renovation provides a secondary opportunity. Project awards tend to reward suppliers that can satisfy public-sector qualification and lifecycle-service expectations.
Europe Escalators & Moving Walkways Market Analysis
Europe is projected to generate USD 2.55 billion by 2035 and grow at a 6.7% CAGR (2026–2035). The regional outlook is supported by aging infrastructure, safety-led renewal, rail-station improvement, and airport modernization. The market's maturity raises the importance of modernization design, compliance knowledge, and low-disruption execution.
Germany
Germany is projected to reach USD 510 million by 2035 and represented 20.0% of European revenue in 2025. Dense rail infrastructure and systematic station upgrades support demand. Compliance-driven renewal strengthens the role of suppliers that can integrate equipment, controls, and dependable maintenance coverage.
United Kingdom
The United Kingdom generated USD 243 million in 2025 and is projected to grow at a 6.7% CAGR (2026–2035). London's extensive and aging transit estate provides sustained modernization opportunities. Procurement depends heavily on delivery assurance, passenger safety, and the capacity to work around active transport operations.
France
France is projected to reach USD 434 million by 2035 and represented 17.0% of European revenue in 2025. Metro improvement, rail-station accessibility, and airport activity support a stable demand base. Modernization opportunities are shaped by public investment schedules and stringent performance requirements.
Middle East & Africa Escalators & Moving Walkways Market Analysis
Middle East & Africa generated USD 975 million in 2025 and is projected to reach USD 2.04 billion by 2035. Large-scale development programs, airport terminals, metro projects, and destination real estate support equipment demand. Major contracts often depend on international OEM qualifications, local delivery partnerships, and the ability to service geographically concentrated installed bases.
Saudi Arabia
Saudi Arabia generated USD 293 million in 2025 and is projected to reach USD 612 million by 2035. Transit, airport, and mixed-use development programs provide the principal opportunity. Project scale attracts global OEMs, while contract execution and post-installation support remain decisive for winning and retaining business.
UAE
The UAE is projected to reach USD 571 million by 2035 and grow at a 7.9% CAGR (2026–2035). Airport operations and urban mobility investment sustain demand for high-availability equipment. The market rewards premium specification, rapid maintenance response, and established commercial relationships.
Latin America Escalators & Moving Walkways Market Analysis
Latin America is projected to reach USD 1.53 billion by 2035 and grow at an 8.9% CAGR (2026–2035). Urban rail expansion, retail construction, and airport upgrades create a comparatively high-growth opportunity from a smaller base. Financing conditions and public-project continuity remain important determinants of timing and supplier participation.
Brazil
Brazil generated USD 371 million in 2025 and is projected to reach USD 842 million by 2035. Large urban transit systems and commercial development create a broad demand base. Local execution capacity and price competitiveness matter alongside technical capability in public and private procurement.
Mexico
Mexico is projected to reach USD 459 million by 2035 and grow at an 8.9% CAGR (2026–2035). Metro renewal, accessibility upgrades, and development in major urban centers support growth. The market offers opportunities for modernization providers as well as new-equipment suppliers.
GMI Analyst View
We view regional performance as being dictated less by broad economic labels than by the durability of public infrastructure commitments. Asia Pacific remains pivotal, but growth leadership is becoming more distributed, while mature markets offer strategically attractive service and modernization revenue where installed-base access is defensible.
Escalators & Moving Walkways Market Share & Competitive Landscape
The escalators & moving walkways market share structure is led by multinational OEMs with extensive manufacturing, engineering, and service footprints, while regional and domestic suppliers compete aggressively in price-sensitive projects. Competitive advantage increasingly depends on qualification capability, installed-base access, digital maintenance tools, component availability, and the ability to complete modernization with minimal disruption.
Otis Worldwide Corporation held a 15.3% global market share in 2025. Its competitive position is supported by a broad service network and a modernization strategy centered on connected equipment, modular upgrades, and recurring maintenance relationships.
KONE Corporation held a 14.7% global market share in 2025. Its market position reflects strength in people-flow solutions, predictive maintenance, and major infrastructure applications, particularly where digital service capability is embedded in customer selection criteria.
Schindler Group held a 13.9% global market share in 2025. The company's rail, airport, and European installed-base presence supports a service-led competitive model, while its remote-monitoring capabilities strengthen retention in regulated and uptime-critical environments.
TK Elevator remains an important competitor in urban mobility and modernization, especially in Europe and the Americas. Mitsubishi Electric holds a strong position in Japan and other Asia Pacific markets through integrated building-systems capability and dense domestic support infrastructure. Beyond the largest OEMs, Hitachi Building Systems, Fujitec, Hyundai Elevator, and Chinese manufacturers such as SJEC, Sigma, Canny, and Guangri broaden price and product competition in local markets.
Recent Industry Developments
KONE Corporation and TK Elevator Announce Transformative Combination (April 29, 2026). KONE and TK Elevator announced a proposed combination with an enterprise value of approximately USD 34.4 billion [4]. Subject to regulatory review, the transaction would materially alter competitive dynamics by combining complementary geographic footprints, installed-base access, and digital-service capabilities.
Otis Launches Global Escalator Modernization Suite, Link™ MOD (May 19, 2026). Otis announced its Link MOD commercial escalator modernization suite on May 19, 2026 [3]. The offering emphasizes modular replacement of critical components while retaining existing truss structures, aligning with asset owners' need to reduce downtime during lifecycle upgrades.
Need a specific section of this report?
Purchase regional analysis, country-level analysis, company profiles, or any other segment-level insights separately
based on your research needs.