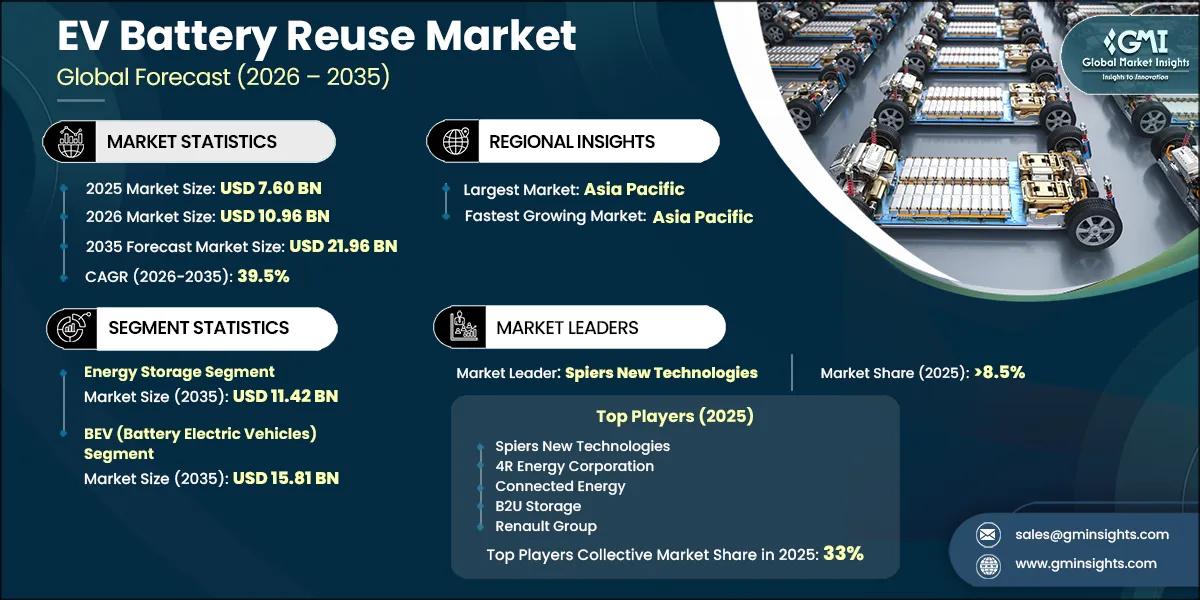
The EV Battery Reuse Market was valued at USD 7.60 billion in 2025, is projected to reach USD 10.96 billion in 2026, expanding at a 39.5% CAGR (2026–2035), to total USD 21.96 billion by 2035.
The EV Battery Reuse Market is moving from project-led repurposing toward a more structured asset-conversion business. Growth depends on aligning retired-pack availability with applications that can tolerate residual-capacity variation, while improved testing, battery-management integration, and module-level grading lower the cost and time required to prepare systems for redeployment.
GMI Analyst View
Based on our assessment of deployed systems data across active second-life projects and direct engagement with commercial operators, the EV Battery Reuse Market reached approximately 11,150 MWh in deployed volume in 2025. This figure confirms that the market has moved decisively past proof-of-concept installations and into aggregated operational capacity at a scale that delivers commercially meaningful grid and industrial services — establishing the technical and commercial foundation for the orders-of-magnitude scaling that the GMI revenue forecast projects through 2035.
EV Battery Reuse Market Trends, Growth Drivers & GMI Forecast Outlook
The market is being propelled by the convergence of a larger pool of retired EV packs and a broader set of storage-oriented use cases, but its revenue conversion will depend on whether repurposers can secure qualified feedstock, control testing costs, and deliver bankable systems into applications with suitable performance requirements.
Key Drivers
Driver
Evidence signal
Market-demand implication
GMI forecast condition
Expanding global EV fleet accelerating battery retirement volumes
Global electric car fleet reached approximately 58 million at end of 2024
Larger cumulative EV stock increases the annual volume of packs crossing the 70–80% State of Health retirement threshold, directly and predictably expanding the feedstock pool available to second-life repurposers
Accelerating retirement volumes through the late 2020s sustain adequate second-life feedstock supply to underpin continuous demand growth without critical input constraints through 2035
Global BESS deployments reached 205 GWh in 2024, up 53% year-over-year
Accelerating large-format grid storage installations expand the primary addressable commercial end-market for second-life battery systems, particularly across energy storage and commercial-industrial applications that tolerate residual-capacity variability
Continued BESS procurement at scale creates sustained demand for cost-competitive second-life alternatives throughout the forecast period, with demand depth well exceeding feasible second-life supply for much of the 2026–2032 window
EU Battery Regulation (EU) 2023/1542, effective February 2024, mandates state-of-health reporting and battery data disclosure for EV batteries placed on the EU market
Standardized SOH data and progressive battery passport requirements reduce information asymmetry between OEMs and second-life operators, lowering due-diligence and procurement transaction costs
Progressive regulatory clarity from 2024 through 2027 is expected to unlock institutional-scale second-life procurement in European and comparably regulated markets, normalizing second-life batteries as a standard input into energy storage project development
*Evidence anchors use cited external data; demand implications and forecast conditions represent GMI analysis.*
The retirement pipeline is becoming commercially consequential rather than episodic. Global EV sales exceeded 17 million units in 2024 and accounted for more than 20% of new vehicle sales worldwide [1]. As earlier vehicle cohorts leave automotive service, repurposers with reliable diagnostic protocols and practical warranty structures can direct usable packs toward applications whose duty cycles do not demand the original vehicle-level energy density.
Stationary storage procurement provides the market with its broadest demand outlet, yet not every storage requirement is appropriate for reused packs. Medium-duration commercial, industrial, and grid-support applications can accommodate managed residual-capacity variation when system design, operating controls, and project economics are aligned. This favors operators able to match pack condition to a defined use case rather than attempting to standardize every incoming battery into a single product format.
Key Restraints
Restraint
Evidence signal
Market-demand implication
GMI forecast condition
New battery cost compression narrowing the second-life price advantage
Battery cell and pack prices declined 20% on a global average basis in 2024 [4]
Narrowing cost gap between new and second-life battery systems reduces the procurement incentive for cost-sensitive stationary storage developers, particularly in markets with aggressive first-life BESS acquisition pipelines and readily available new capacity
Price convergence risk is most acute in the 2026–2028 window; scale economies in refurbishment and the structural cost advantage of zero-cost battery feedstock are expected to re-establish second-life commercial competitiveness for appropriate applications through the latter portion of the forecast period
EU Battery Regulation (EU) 2023/1542, Article 8, mandates a minimum of 16% recycled cobalt content in new batteries from 2031, increasing to 26% by 2036
Regulatory recycling content requirements create economic incentive for OEMs and battery collectors to route end-of-life packs to recyclers ahead of second-life repurposers, tightening available feedstock in regulated markets and particularly for high-SOH packs that both industries compete to acquire
Feedstock competition from recyclers becomes structurally acute from approximately 2028, requiring second-life operators in regulated markets to secure long-term battery offtake agreements substantially in advance of commercial deployment
State-of-health assessment complexity raising testing cost and reducing throughput
EU Battery Regulation (EU) 2023/1542 establishes SOH-reporting requirements for EU-market EV batteries from February 2024; no equivalent harmonized global standard for SOH certification exists across Asia Pacific and North American markets at equivalent regulatory force
Inconsistent state-of-health grading methodologies across markets increase per-unit testing overhead, extend quality assurance cycles, and constrain the commercial throughput of repurposing facilities — disadvantaging smaller operators who cannot amortize high fixed testing costs across large battery volumes
Standard fragmentation is expected to remain a structural friction point through approximately 2029, after which bilateral and multilateral policy alignment and commercial standardization are anticipated to progressively reduce per-unit testing cost
*Evidence anchors use cited external data; demand implications and forecast conditions represent GMI analysis.*
Second-life economics are sensitive to the alternative cost of new storage capacity. Where new systems become readily available at aggressive prices, reuse operators must demonstrate value through lower installed cost, faster access to suitable equipment, or fit with a specialized operating profile. The strongest commercial cases therefore depend on disciplined screening and application design rather than on a generalized price discount.
Feedstock competition also introduces a strategic constraint. Batteries with useful remaining life can be attractive both to repurposers and to material-recovery channels, while differing diagnostic practices make it difficult to transact pack inventories at scale. Long-term OEM relationships, credible test records, and repeatable qualification methods will increasingly separate operators that can sustain throughput from those dependent on opportunistic supply.
GMI Analyst View
We view the central forecast tension as a contest between maturing battery supply and the pace at which first-life battery economics narrow the reuse proposition. Operators that secure feedstock early, establish credible condition assessment, and concentrate on applications with clear tolerance for residual-capacity variation should retain the strongest commercial position.
EV Battery Reuse Market Segment Analysis
By Application
The EV Battery Reuse Market is differentiated by application because each end use places a distinct premium on capacity retention, discharge characteristics, warranty expectations, installation format, and control-system integration.
Energy Storage generated USD 418.2 million in 2025 and is projected to reach USD 11.42 billion by 2035. Stationary storage provides the broadest commercial pathway because aggregated systems can be engineered around the remaining performance of individual modules. Behind-the-meter installations, renewable-energy support, and grid services can convert residual capacity into value when integrators pair robust battery-management controls with applications that do not require the most demanding cycle profile.[3]
EV Charging accounted for 20.0% of global second-life battery revenue in 2025 and is expected to expand at a 42.4% CAGR (2026–2035). Co-located storage can reduce peak-load exposure at charging sites and defer costly grid upgrades for fleet depots and high-utilization chargers. This is an additive use case: the second-life system can make a charging installation feasible where utility capacity, connection timing, or demand-charge exposure would otherwise constrain deployment.
Base Stations represented 15.0% of global second-life battery revenue in 2025 and are forecast to reach USD 3.07 billion by 2035. Telecom backup aligns with the operating profile of many reused packs because backup duty generally prioritizes dependable stored energy over automotive-grade range or acceleration. The principal commercial challenge is not application fit, but the cost of integrating varied pack architectures into standardized telecom power systems.
Low-Speed Vehicles generated USD 76.0 million in 2025 and are expected to hold a 10.0% share of the global second-life market by 2035. Low-speed mobility can extend the usable life of packs that no longer meet passenger-vehicle expectations. This channel is particularly suitable for utility vehicles and localized transport, where moderate energy demand and lower operating intensity permit reuse without replicating the performance requirements of full automotive service.
By Source
BEV (Battery Electric Vehicles) accounted for 68.0% of global second-life battery revenue in 2025 and are projected to contribute USD 15.81 billion by 2035. BEV packs are the core feedstock for larger repurposed systems because their energy capacity supports stationary storage and charging-buffer configurations that require meaningful throughput. The expansion of BEV retirements also improves the commercial case for standardized diagnostics, module sorting, and system-integration platforms.
HEV & PHEV (Hybrid & Plug-in Hybrid) generated USD 243.3 million in 2025 and are expected to represent 28.0% of global second-life battery revenue by 2035. Hybrid-derived packs can serve smaller backup, light-mobility, and distributed-storage uses, although their format and duty history can constrain aggregation into larger systems. Their declining relative role reflects the broader shift in battery retirement feedstock toward larger BEV packs, which offer more attractive unit economics for repurposers.
GMI Analyst View
We believe application selection will determine value creation more decisively than feedstock volume alone. Energy storage remains the principal revenue outlet, but charging-buffer systems offer a differentiated route to demand because they solve infrastructure constraints rather than simply competing against new batteries on acquisition cost.
EV Battery Reuse Market Regional Analysis
Asia Pacific EV Battery Reuse Market Analysis
The Asia Pacific EV Battery Reuse Market generated USD 319.4 million in 2025 and is forecast to reach USD 10.32 billion by 2035. The region combines deep EV production and deployment, substantial battery-manufacturing capability, and rapidly expanding storage requirements. Its advantage lies not only in feedstock scale, but also in the availability of suppliers, diagnostic capacity, and downstream buyers able to support industrialized repurposing models.
China
China generated USD 207.6 million in 2025 and is expected to reach USD 6.40 billion by 2035. China's scale is grounded in its EV market, which represented approximately two-thirds of global EV sales . Battery traceability requirements, established collection infrastructure, and integrated domestic supply chains provide a more structured foundation for cascaded battery use across stationary storage, telecom backup, and light-mobility applications.
Japan
Japan represented 17.0% of Asia Pacific second-life battery revenue in 2025 and is projected to reach USD 1.54 billion by 2035. Japan benefits from a long operating history with hybrid and early battery-electric vehicles, creating comparatively mature experience with battery collection and condition assessment. The transition toward a larger BEV retirement stream should improve the availability of higher-capacity packs for grid-flexibility and commercial-storage applications.
South Korea
South Korea generated USD 31.9 million in 2025 and is anticipated to grow at a 44.0% CAGR (2026–2035). The market is supported by domestic OEM activity and a battery-manufacturing base with strategic incentives to extend participation across the battery lifecycle. This positions reuse programs as both a circularity initiative and a way for manufacturers to retain commercial visibility over post-vehicle battery flows.
India
India accounted for 6.0% of Asia Pacific second-life battery revenue in 2025 and is projected to grow at a 47.6% CAGR (2026–2035). India's opportunity is linked to the maturation of electric two- and three-wheeler, commercial-vehicle, and passenger-vehicle fleets, together with demand for distributed backup power. Telecom infrastructure and uneven grid reliability create a practical route for second-life systems where conventional backup solutions carry recurring operating costs.
Australia
Australia generated USD 6.4 million in 2025 and is expected to reach USD 206.5 million by 2035. The market is likely to develop around distributed energy uses, particularly behind-the-meter and community storage linked to high renewable-energy penetration. These applications can reward systems that reduce local peak exposure and improve the use of intermittent solar generation.
North America EV Battery Reuse Market Analysis
North America generated USD 182.5 million in 2025 and is projected to reach USD 4.61 billion by 2035. The regional opportunity is led by stationary-storage procurement and growing availability of retired EV packs. Commercial success will be shaped by the extent to which independent repurposers can access characterized feedstock alongside OEM-led battery programs and meet the underwriting requirements of utility and commercial customers.
U.S.
The U.S. generated USD 160.6 million in 2025 and is forecast to reach USD 4.05 billion by 2035. High-EV-adoption states with active storage procurement offer the strongest near-term operating environment. Project developers can use second-life systems in commercial and grid-support installations where site-specific economics justify additional qualification work and where structured OEM supply channels reduce feedstock uncertainty.
Canada
Canada represented 12.0% of North American second-life battery revenue in 2025 and is expected to grow at a 37.6% CAGR (2026–2035). The Canadian market remains at an earlier commercialization stage, but increasing EV penetration and provincial renewable-energy development are creating the necessary conditions for feedstock accumulation and stationary-storage demand. Provincial procurement patterns will determine where early projects reach investable scale.
Europe EV Battery Reuse Market Analysis
Europe generated USD 205.3 million in 2025 and is forecast to reach USD 5.49 billion by 2035. Europe's role is reinforced by its battery-circularity framework and established renewable-energy storage demand. Regulatory requirements governing battery information and producer responsibility reduce uncertainty in pack evaluation, although the region's commercial expansion will still depend on the economics of new batteries and the willingness of OEMs to make suitable packs available for reuse.
Germany
Germany generated USD 57.5 million in 2025 and is projected to reach USD 1.64 billion by 2035. A large automotive manufacturing base gives Germany a material advantage in prospective battery-retirement volumes. Domestic energy-transition needs and OEM circularity programs support a market in which pack supply, industrial integration, and storage demand can be developed in parallel.
UK
The UK generated USD 41.1 million in 2025 and is anticipated to grow at a 37.7% CAGR (2026–2035). Grid-flexibility markets and commercial-industrial storage demand support the UK's second-life project pipeline. Connected Energy's partnership with Forsee Power to develop grid-scale systems using electric-bus battery packs illustrates how fleet-derived feedstock can support modular storage deployment [5].
France
France generated USD 34.9 million in 2025 and is expected to expand at a 40.2% CAGR (2026–2035). France combines an active EV manufacturing base with a regulatory environment that supports battery circularity. Established OEM participation provides a useful commercial template for linking retired-vehicle batteries to domestic storage applications while retaining traceability through the value chain.
Italy
Italy generated USD 26.7 million in 2025 and is projected to reach USD 658.8 million by 2035. Commercial and industrial customers facing elevated electricity costs provide a logical demand base for storage systems that can improve energy management. The development of organized OEM circularity channels can further reduce the transaction friction associated with sourcing and qualifying heterogeneous battery inventories.
Spain
Spain generated USD 22.6 million in 2025 and is anticipated to grow at a 38.5% CAGR (2026–2035). Spain's renewable-energy buildout expands the need for flexible storage across grid and commercial settings. Second-life deployment will be most compelling where operators can offer systems with clear performance guarantees and align their output profile with local renewable-generation patterns.
Russia
Russia generated USD 22.6 million in 2025 and is expected to hold a 9.0% share of European second-life battery revenue by 2035. The market is constrained by a smaller domestic EV base than many European peers and by reduced access to advanced battery supply chains. These conditions limit both the scale of available feedstock and the pace at which local repurposing capability can mature.
Rest of World EV Battery Reuse Market Analysis
Rest of World markets represented 7.0% of global second-life battery revenue in 2025 and are forecast to reach USD 1.53 billion by 2035. Early demand in these markets is likely to center on telecom backup, off-grid power, and localized storage rather than large-scale grid projects. As EV fleets mature, the combination of battery availability and distributed-energy needs can create a broader commercial base for reuse beyond the major established regions.
GMI Analyst View
We expect Asia Pacific's advantage to remain structural because feedstock scale, battery-industry depth, and downstream demand are mutually reinforcing. Outside China, the most compelling regional opportunities will depend on distinct local catalysts: OEM-led supply security, credible storage offtake, and regulatory systems that make battery condition and ownership easier to establish.
EV Battery Reuse Market Share & Competitive Landscape
The EV Battery Reuse Market share structure is fragmented, with the top five participants, including Spiers New Technologies, 4R Energy Corporation, Connected Energy, B2U Storage, and Renault Group, collectively holding approximately 33% of global revenue in 2025. Competition is shaped by access to consistent feedstock, diagnostic and refurbishment capability, application-specific integration expertise, and the ability to provide credible warranties to commercial buyers.
Spiers New Technologies held an estimated 8.5% share of global market revenue in 2025. Its position reflects established North American capabilities in battery testing, grading, refurbishment, and system integration. Structured OEM relationships and operational experience with varied battery inventories can provide an advantage where commercial customers require documented pack condition and dependable supply.
4R Energy Corporation accounted for approximately 7.5% of global market revenue in 2025. The Nissan-Sumitomo joint venture benefits from access to a well-characterized battery stream and a long operating history in organized repurposing. That defined feedstock base can simplify qualification and product design relative to multi-OEM operators managing disparate battery architectures.
Connected Energy represented approximately 6.0% of global market revenue in 2025. The company's commercial model centers on modular second-life storage for commercial and industrial users, with value derived from combining on-site energy management and grid-service opportunities. Its project experience illustrates the importance of application-specific integration and bankable operating structures in European second-life storage.
B2U Storage Solutions has developed a large-format second-life storage approach based on retaining EV packs in a plug-and-play architecture where possible. This configuration can reduce remanufacturing requirements and shorten deployment timelines, particularly in markets where grid-services revenue supports utility-scale and commercial storage projects. Its activity in California and Texas demonstrates how regional market design can influence the attractiveness of second-life BESS deployment.
Renault Group operates a visible OEM-led second-life program supported by access to batteries from its vehicle base. Vertical integration can improve feedstock visibility and make it easier to preserve battery information throughout collection, qualification, and redeployment. The model highlights the competitive relevance of OEM participation as battery circularity becomes more closely tied to vehicle-lifecycle strategy.
Recent Industry Developments
B2U Storage Solutions - Structured Finance Fund Launch. In December 2025, B2U Storage Solutions launched a structured finance fund covering approximately 150 MWh of grid-storage capacity across seven BESS projects in California and Texas [6]. The vehicle is designed to recycle capital from operating projects into further deployment, signaling a shift toward portfolio-level financing structures for second-life storage assets.
Stellantis SUSTAINera - AVATHOR ONE Second-Life Battery Application. In September 2025, Stellantis announced that its SUSTAINera business had deployed repurposed high-voltage battery modules from end-of-life vehicles into the AVATHOR ONE mobility device through an agreement with INTENT S.r.l. [7]. The initiative demonstrates a specialized mobility application for reused modules outside conventional stationary storage.
Need a specific section of this report?
Purchase regional analysis, country-level analysis, company profiles, or any other segment-level insights separately
based on your research needs.
Authors: Ankit Gupta, Vishal Saini
EV Battery Reuse Market Scope
EV Battery Reuse Market Size
EV Battery Reuse Market Trends
EV Battery Reuse Market Analysis
EV Battery Reuse Market Share
Report Content
Chapter 1. Methodology & Scope
1.1 Research design
1.1.1 Research approach
1.1.2 Data collection methods
1.2 Base estimates and calculations
1.2.1 Base year calculation
1.2.2 Market estimates & forecast parameters
1.3 Forecast
1.3.1 Key trends for market estimates
1.3.2 Quantified market impact analysis
1.3.2.1 Mathematical impact of growth parameters on forecast
1.3.3 Scenario analysis framework
1.4 Primary research and validation
1.4.1 Some of the primary sources (but not limited to)
1.5 Data mining sources
1.5.1 Paid Sources
1.5.2 Sources, by region
1.6 Research trail & scoring components
1.6.1 Research trail components
1.6.2 Scoring components
1.7 Research transparency addendum
1.7.1 Source attribution framework
1.7.2 Quality assurance metrics
1.7.3 Our commitment to trust
1.8 Market definitions
Chapter 2. Executive Summary
2.1 Industry synopsis, 2022 - 2035
2.2 Business trends
2.3 Application trends
2.4 Source trends
2.5 Regional trends
Chapter 3. Industry Insights
3.1 Industry ecosystem analysis
3.2 Regulatory landscape
3.3 Industry impact forces
3.3.1 Growth drivers
3.3.2 Industry pitfalls & challenges
3.4 Growth potential analysis
3.5 Porter's analysis
3.5.1 Bargaining power of suppliers
3.5.2 Bargaining power of buyers
3.5.3 Threat of new entrants
3.5.4 Threat of substitutes
3.6 PESTEL analysis
3.6.1 Political factors
3.6.2 Economic factors
3.6.3 Social factors
3.6.4 Technological factors
3.6.5 Legal factors
3.6.6 Environmental factors
3.7 Price trend analysis, 2022-2035 (USD/MWh)
3.8 Emerging opportunities & trends
3.9 Investment analysis & future prospects
Chapter 4. Competitive landscape, 2025
4.1 Introduction
4.2 Company market share analysis, 2025
4.3 Key developments
4.3.1 Mergers & acquisitions
4.3.2 Partnerships & collaborations
4.3.3 New product launches
4.3.4 Expansion plans and funding
4.4 Competitive benchmarking
4.5 Innovation & sustainability landscape
Chapter 5. Market Size and Forecast, By Application, 2022 – 2035 (MWh & USD Million)
5.1 Key trends
5.2 Energy storage
5.3 EV charging
5.4 Base stations
5.5 Low speed vehicles
Chapter 6. Market Size and Forecast, By Source, 2022 – 2035 (MWh & USD Million)
6.1 Key trends
6.2 BEV
6.3 HEV & PHEV
Chapter 7. Market Size and Forecast, By Region, 2022 – 2035 (MWh & USD Million)
7.1 Key trends
7.2 North America
7.2.1 U.S.
7.2.2 Canada
7.3 Europe
7.3.1 UK
7.3.2 Germany
7.3.3 Italy
7.3.4 Spain
7.3.5 Russia
7.3.6 France
7.4 Asia Pacific
7.4.1 China
7.4.2 Japan
7.4.3 South Korea
7.4.4 India
7.4.5 Australia
7.5 Rest of the world
Chapter 8. Company Profiles
Don't see your key competitors?
The companies listed in this report are a curated selection - not the full competitive universe.
Our market revenue calculations use a bottom-up methodology that accounts for all players across all regions - including manufacturers, distributors, and specialists not individually profiled. The profiles section spotlights strategically significant players; it does not define the scope of our market sizing.
Your competitive landscape may also include
Regional or domestic-only leaders not in the global top tier
Distributors and channel partners who control market access
Emerging disruptors, startups, or adjacent-industry entrants
Niche players focused on a specific application or end-use
Free customization - up to 20% of report value
Need specific data? Request customization and get the insights tailored to your exact requirements.
For inquiries regarding discounts, bulk purchases, or customization requests, please contact us at[email protected]
Over 70% of our clients customize reports to fit their needs. Please tell us how you would like to customize yours below
Share Content
Add Citations
Ankit Gupta. 2026, September. EV Battery Reuse Market Size - By Application, By Source & Forecast, 2026 - 2035 (Report ID: GMI4812). Global Market Insights Inc. Retrieved November 3, 2026, from https://www.gminsights.com/toc/details/ev-battery-reuse-market
EV Battery Reuse Market
Get a free sample of this report
Get a free sample of this report EV Battery Reuse Market
Is your requirement urgent? Please give us your business email for a speedy delivery!



EV Battery Reuse Market Size
The EV Battery Reuse Market was valued at USD 7.60 billion in 2025, is projected to reach USD 10.96 billion in 2026, expanding at a 39.5% CAGR (2026–2035), to total USD 21.96 billion by 2035.
The EV Battery Reuse Market is moving from project-led repurposing toward a more structured asset-conversion business. Growth depends on aligning retired-pack availability with applications that can tolerate residual-capacity variation, while improved testing, battery-management integration, and module-level grading lower the cost and time required to prepare systems for redeployment.
GMI Analyst View
Based on our assessment of deployed systems data across active second-life projects and direct engagement with commercial operators, the EV Battery Reuse Market reached approximately 11,150 MWh in deployed volume in 2025. This figure confirms that the market has moved decisively past proof-of-concept installations and into aggregated operational capacity at a scale that delivers commercially meaningful grid and industrial services — establishing the technical and commercial foundation for the orders-of-magnitude scaling that the GMI revenue forecast projects through 2035.
EV Battery Reuse Market Trends, Growth Drivers & GMI Forecast Outlook
The market is being propelled by the convergence of a larger pool of retired EV packs and a broader set of storage-oriented use cases, but its revenue conversion will depend on whether repurposers can secure qualified feedstock, control testing costs, and deliver bankable systems into applications with suitable performance requirements.
Key Drivers
*Evidence anchors use cited external data; demand implications and forecast conditions represent GMI analysis.*
The retirement pipeline is becoming commercially consequential rather than episodic. Global EV sales exceeded 17 million units in 2024 and accounted for more than 20% of new vehicle sales worldwide [1]. As earlier vehicle cohorts leave automotive service, repurposers with reliable diagnostic protocols and practical warranty structures can direct usable packs toward applications whose duty cycles do not demand the original vehicle-level energy density.
Stationary storage procurement provides the market with its broadest demand outlet, yet not every storage requirement is appropriate for reused packs. Medium-duration commercial, industrial, and grid-support applications can accommodate managed residual-capacity variation when system design, operating controls, and project economics are aligned. This favors operators able to match pack condition to a defined use case rather than attempting to standardize every incoming battery into a single product format.
Key Restraints
*Evidence anchors use cited external data; demand implications and forecast conditions represent GMI analysis.*
Second-life economics are sensitive to the alternative cost of new storage capacity. Where new systems become readily available at aggressive prices, reuse operators must demonstrate value through lower installed cost, faster access to suitable equipment, or fit with a specialized operating profile. The strongest commercial cases therefore depend on disciplined screening and application design rather than on a generalized price discount.
Feedstock competition also introduces a strategic constraint. Batteries with useful remaining life can be attractive both to repurposers and to material-recovery channels, while differing diagnostic practices make it difficult to transact pack inventories at scale. Long-term OEM relationships, credible test records, and repeatable qualification methods will increasingly separate operators that can sustain throughput from those dependent on opportunistic supply.
GMI Analyst View
We view the central forecast tension as a contest between maturing battery supply and the pace at which first-life battery economics narrow the reuse proposition. Operators that secure feedstock early, establish credible condition assessment, and concentrate on applications with clear tolerance for residual-capacity variation should retain the strongest commercial position.
EV Battery Reuse Market Segment Analysis
By Application
The EV Battery Reuse Market is differentiated by application because each end use places a distinct premium on capacity retention, discharge characteristics, warranty expectations, installation format, and control-system integration.
Energy Storage generated USD 418.2 million in 2025 and is projected to reach USD 11.42 billion by 2035. Stationary storage provides the broadest commercial pathway because aggregated systems can be engineered around the remaining performance of individual modules. Behind-the-meter installations, renewable-energy support, and grid services can convert residual capacity into value when integrators pair robust battery-management controls with applications that do not require the most demanding cycle profile.[3]
EV Charging accounted for 20.0% of global second-life battery revenue in 2025 and is expected to expand at a 42.4% CAGR (2026–2035). Co-located storage can reduce peak-load exposure at charging sites and defer costly grid upgrades for fleet depots and high-utilization chargers. This is an additive use case: the second-life system can make a charging installation feasible where utility capacity, connection timing, or demand-charge exposure would otherwise constrain deployment.
Base Stations represented 15.0% of global second-life battery revenue in 2025 and are forecast to reach USD 3.07 billion by 2035. Telecom backup aligns with the operating profile of many reused packs because backup duty generally prioritizes dependable stored energy over automotive-grade range or acceleration. The principal commercial challenge is not application fit, but the cost of integrating varied pack architectures into standardized telecom power systems.
Low-Speed Vehicles generated USD 76.0 million in 2025 and are expected to hold a 10.0% share of the global second-life market by 2035. Low-speed mobility can extend the usable life of packs that no longer meet passenger-vehicle expectations. This channel is particularly suitable for utility vehicles and localized transport, where moderate energy demand and lower operating intensity permit reuse without replicating the performance requirements of full automotive service.
By Source
BEV (Battery Electric Vehicles) accounted for 68.0% of global second-life battery revenue in 2025 and are projected to contribute USD 15.81 billion by 2035. BEV packs are the core feedstock for larger repurposed systems because their energy capacity supports stationary storage and charging-buffer configurations that require meaningful throughput. The expansion of BEV retirements also improves the commercial case for standardized diagnostics, module sorting, and system-integration platforms.
HEV & PHEV (Hybrid & Plug-in Hybrid) generated USD 243.3 million in 2025 and are expected to represent 28.0% of global second-life battery revenue by 2035. Hybrid-derived packs can serve smaller backup, light-mobility, and distributed-storage uses, although their format and duty history can constrain aggregation into larger systems. Their declining relative role reflects the broader shift in battery retirement feedstock toward larger BEV packs, which offer more attractive unit economics for repurposers.
GMI Analyst View
We believe application selection will determine value creation more decisively than feedstock volume alone. Energy storage remains the principal revenue outlet, but charging-buffer systems offer a differentiated route to demand because they solve infrastructure constraints rather than simply competing against new batteries on acquisition cost.
EV Battery Reuse Market Regional Analysis
Asia Pacific EV Battery Reuse Market Analysis
The Asia Pacific EV Battery Reuse Market generated USD 319.4 million in 2025 and is forecast to reach USD 10.32 billion by 2035. The region combines deep EV production and deployment, substantial battery-manufacturing capability, and rapidly expanding storage requirements. Its advantage lies not only in feedstock scale, but also in the availability of suppliers, diagnostic capacity, and downstream buyers able to support industrialized repurposing models.
China
China generated USD 207.6 million in 2025 and is expected to reach USD 6.40 billion by 2035. China's scale is grounded in its EV market, which represented approximately two-thirds of global EV sales . Battery traceability requirements, established collection infrastructure, and integrated domestic supply chains provide a more structured foundation for cascaded battery use across stationary storage, telecom backup, and light-mobility applications.
Japan
Japan represented 17.0% of Asia Pacific second-life battery revenue in 2025 and is projected to reach USD 1.54 billion by 2035. Japan benefits from a long operating history with hybrid and early battery-electric vehicles, creating comparatively mature experience with battery collection and condition assessment. The transition toward a larger BEV retirement stream should improve the availability of higher-capacity packs for grid-flexibility and commercial-storage applications.
South Korea
South Korea generated USD 31.9 million in 2025 and is anticipated to grow at a 44.0% CAGR (2026–2035). The market is supported by domestic OEM activity and a battery-manufacturing base with strategic incentives to extend participation across the battery lifecycle. This positions reuse programs as both a circularity initiative and a way for manufacturers to retain commercial visibility over post-vehicle battery flows.
India
India accounted for 6.0% of Asia Pacific second-life battery revenue in 2025 and is projected to grow at a 47.6% CAGR (2026–2035). India's opportunity is linked to the maturation of electric two- and three-wheeler, commercial-vehicle, and passenger-vehicle fleets, together with demand for distributed backup power. Telecom infrastructure and uneven grid reliability create a practical route for second-life systems where conventional backup solutions carry recurring operating costs.
Australia
Australia generated USD 6.4 million in 2025 and is expected to reach USD 206.5 million by 2035. The market is likely to develop around distributed energy uses, particularly behind-the-meter and community storage linked to high renewable-energy penetration. These applications can reward systems that reduce local peak exposure and improve the use of intermittent solar generation.
North America EV Battery Reuse Market Analysis
North America generated USD 182.5 million in 2025 and is projected to reach USD 4.61 billion by 2035. The regional opportunity is led by stationary-storage procurement and growing availability of retired EV packs. Commercial success will be shaped by the extent to which independent repurposers can access characterized feedstock alongside OEM-led battery programs and meet the underwriting requirements of utility and commercial customers.
U.S.
The U.S. generated USD 160.6 million in 2025 and is forecast to reach USD 4.05 billion by 2035. High-EV-adoption states with active storage procurement offer the strongest near-term operating environment. Project developers can use second-life systems in commercial and grid-support installations where site-specific economics justify additional qualification work and where structured OEM supply channels reduce feedstock uncertainty.
Canada
Canada represented 12.0% of North American second-life battery revenue in 2025 and is expected to grow at a 37.6% CAGR (2026–2035). The Canadian market remains at an earlier commercialization stage, but increasing EV penetration and provincial renewable-energy development are creating the necessary conditions for feedstock accumulation and stationary-storage demand. Provincial procurement patterns will determine where early projects reach investable scale.
Europe EV Battery Reuse Market Analysis
Europe generated USD 205.3 million in 2025 and is forecast to reach USD 5.49 billion by 2035. Europe's role is reinforced by its battery-circularity framework and established renewable-energy storage demand. Regulatory requirements governing battery information and producer responsibility reduce uncertainty in pack evaluation, although the region's commercial expansion will still depend on the economics of new batteries and the willingness of OEMs to make suitable packs available for reuse.
Germany
Germany generated USD 57.5 million in 2025 and is projected to reach USD 1.64 billion by 2035. A large automotive manufacturing base gives Germany a material advantage in prospective battery-retirement volumes. Domestic energy-transition needs and OEM circularity programs support a market in which pack supply, industrial integration, and storage demand can be developed in parallel.
UK
The UK generated USD 41.1 million in 2025 and is anticipated to grow at a 37.7% CAGR (2026–2035). Grid-flexibility markets and commercial-industrial storage demand support the UK's second-life project pipeline. Connected Energy's partnership with Forsee Power to develop grid-scale systems using electric-bus battery packs illustrates how fleet-derived feedstock can support modular storage deployment [5].
France
France generated USD 34.9 million in 2025 and is expected to expand at a 40.2% CAGR (2026–2035). France combines an active EV manufacturing base with a regulatory environment that supports battery circularity. Established OEM participation provides a useful commercial template for linking retired-vehicle batteries to domestic storage applications while retaining traceability through the value chain.
Italy
Italy generated USD 26.7 million in 2025 and is projected to reach USD 658.8 million by 2035. Commercial and industrial customers facing elevated electricity costs provide a logical demand base for storage systems that can improve energy management. The development of organized OEM circularity channels can further reduce the transaction friction associated with sourcing and qualifying heterogeneous battery inventories.
Spain
Spain generated USD 22.6 million in 2025 and is anticipated to grow at a 38.5% CAGR (2026–2035). Spain's renewable-energy buildout expands the need for flexible storage across grid and commercial settings. Second-life deployment will be most compelling where operators can offer systems with clear performance guarantees and align their output profile with local renewable-generation patterns.
Russia
Russia generated USD 22.6 million in 2025 and is expected to hold a 9.0% share of European second-life battery revenue by 2035. The market is constrained by a smaller domestic EV base than many European peers and by reduced access to advanced battery supply chains. These conditions limit both the scale of available feedstock and the pace at which local repurposing capability can mature.
Rest of World EV Battery Reuse Market Analysis
Rest of World markets represented 7.0% of global second-life battery revenue in 2025 and are forecast to reach USD 1.53 billion by 2035. Early demand in these markets is likely to center on telecom backup, off-grid power, and localized storage rather than large-scale grid projects. As EV fleets mature, the combination of battery availability and distributed-energy needs can create a broader commercial base for reuse beyond the major established regions.
GMI Analyst View
We expect Asia Pacific's advantage to remain structural because feedstock scale, battery-industry depth, and downstream demand are mutually reinforcing. Outside China, the most compelling regional opportunities will depend on distinct local catalysts: OEM-led supply security, credible storage offtake, and regulatory systems that make battery condition and ownership easier to establish.
EV Battery Reuse Market Share & Competitive Landscape
The EV Battery Reuse Market share structure is fragmented, with the top five participants, including Spiers New Technologies, 4R Energy Corporation, Connected Energy, B2U Storage, and Renault Group, collectively holding approximately 33% of global revenue in 2025. Competition is shaped by access to consistent feedstock, diagnostic and refurbishment capability, application-specific integration expertise, and the ability to provide credible warranties to commercial buyers.
Spiers New Technologies held an estimated 8.5% share of global market revenue in 2025. Its position reflects established North American capabilities in battery testing, grading, refurbishment, and system integration. Structured OEM relationships and operational experience with varied battery inventories can provide an advantage where commercial customers require documented pack condition and dependable supply.
4R Energy Corporation accounted for approximately 7.5% of global market revenue in 2025. The Nissan-Sumitomo joint venture benefits from access to a well-characterized battery stream and a long operating history in organized repurposing. That defined feedstock base can simplify qualification and product design relative to multi-OEM operators managing disparate battery architectures.
Connected Energy represented approximately 6.0% of global market revenue in 2025. The company's commercial model centers on modular second-life storage for commercial and industrial users, with value derived from combining on-site energy management and grid-service opportunities. Its project experience illustrates the importance of application-specific integration and bankable operating structures in European second-life storage.
B2U Storage Solutions has developed a large-format second-life storage approach based on retaining EV packs in a plug-and-play architecture where possible. This configuration can reduce remanufacturing requirements and shorten deployment timelines, particularly in markets where grid-services revenue supports utility-scale and commercial storage projects. Its activity in California and Texas demonstrates how regional market design can influence the attractiveness of second-life BESS deployment.
Renault Group operates a visible OEM-led second-life program supported by access to batteries from its vehicle base. Vertical integration can improve feedstock visibility and make it easier to preserve battery information throughout collection, qualification, and redeployment. The model highlights the competitive relevance of OEM participation as battery circularity becomes more closely tied to vehicle-lifecycle strategy.
Recent Industry Developments
B2U Storage Solutions - Structured Finance Fund Launch. In December 2025, B2U Storage Solutions launched a structured finance fund covering approximately 150 MWh of grid-storage capacity across seven BESS projects in California and Texas [6]. The vehicle is designed to recycle capital from operating projects into further deployment, signaling a shift toward portfolio-level financing structures for second-life storage assets.
Stellantis SUSTAINera - AVATHOR ONE Second-Life Battery Application. In September 2025, Stellantis announced that its SUSTAINera business had deployed repurposed high-voltage battery modules from end-of-life vehicles into the AVATHOR ONE mobility device through an agreement with INTENT S.r.l. [7]. The initiative demonstrates a specialized mobility application for reused modules outside conventional stationary storage.
Need a specific section of this report?
Purchase regional analysis, country-level analysis, company profiles, or any other segment-level insights separately
based on your research needs.