
Authors:
Avinash Singh, Amit Patil
Download free PDF
North America Down Alternative Mattresses Market Size & Share 2026-2035
Report ID: GMI15952
|
Published Date: August 2026
|
Report Format: PDF/Excel/Dashboard/Platform
Download Free PDF
Explore Our Licensing Options:
Download Free PDF

North America Down Alternative Mattresses Market
Get a free sample of this report
What are you hoping to find?
Your PDF is on its way. Tell us little about your research goal, and we'll help you find the most relevant market insights.
North America Down Alternative Mattresses Market Size
The North America down alternative mattresses market was valued at USD 778.2 million in 2025 and is projected to reach USD 1.14 billion by 2035, expanding at a 4% CAGR. Revenue is expected to rise to USD 809.4 million in 2026 .
North America Down Alternative Mattresses Market Key Takeaways
Market Leader: Tempur Sealy International led with over 15% market share in 2025.
Leading Players: Top 5 players in this market include Tempur Sealy International, Serta Simmons Bedding, Sleep Number Corporation, Purple Innovation, Casper Sleep, which collectively held a market share of 52% in 2025.
The market is defined as demand-side revenue from mattresses whose primary comfort or filling component uses non-down alternatives, including cotton, polyester, wool, bamboo, silk, kapok, and related materials; conventional feather/down mattresses, standalone toppers, and mattresses in which memory foam, latex, innerspring, or hybrid construction is the primary component are excluded.
Growth is measured rather than explosive. The market's USD 371 million increase over 2025–2035 reflects a mature replacement-led bedding environment in which product differentiation must justify purchase rather than rely on first-time category adoption. Alternative-fill propositions are most commercially relevant where brands can combine comfort positioning with material choice, firmness options, and a delivery model that reduces the friction of replacing a bulky durable good.
Demand is anchored in residential purchasing, while hotel, healthcare, and other institutional requirements widen the addressable base. The category's appeal is also shaped by a practical contrast: synthetic and natural alternatives permit brands to offer different comfort and material narratives without relying on animal-sourced down. That flexibility supports price architecture from accessible offerings to premium, material-led products.
GMI Analyst View
The projected 4.0% CAGR indicates that North American category expansion depends less on category novelty than on replacement conversion and mix improvement. A supplier that treats "down alternative" only as a fill descriptor risks competing on a narrow and easily replicated feature. The stronger commercial position comes from connecting material selection to a credible customer outcome, such as a preferred hand feel, care profile, temperature experience, or natural-material proposition, then delivering that proposition consistently across sizes and channels.
Key Drivers
Material-led replacement demand
Alternative-fill mattresses give consumers a choice between natural and synthetic material narratives without moving outside the mattress category. Cotton remains the largest material benchmark at 37.2% of the 2025 segmentation base, while bamboo carries the highest projected growth rate at 6.4%. This divergence matters: cotton supports scale and familiarity, whereas bamboo's faster growth points to a smaller but strategically useful route for brands seeking to differentiate on material positioning rather than on broad discounting alone.
Comfort customization across firmness and size
Medium firmness accounts for 46.2% of the 2025 segmentation base, making it the central configuration around which a broad assortment can be built. At the same time, soft products are projected to grow faster, at 5.1%, indicating that a standardized medium offering may leave incremental demand unserved. Queen size leads at 35.6%, but the faster projected growth of larger "other" sizes, including king and California king, at 6.4% suggests that higher-ticket room configurations are important to future value growth.
Digitally enabled purchase and fulfillment
Online e-commerce websites account for 28.0% of the 2025 channel benchmark, and company-owned websites are the fastest-growing route at 7.5% CAGR. A direct site allows a brand to control material explanation, firmness guidance, trial terms, warranty communication, and the presentation of upgrade options. For a product that is difficult to evaluate through a specification sheet alone, the commercial value of the owned channel is not merely lower intermediary dependence; it is the ability to translate comfort and material differences into a purchase decision before the product reaches the customer.
Commercial replacement cycles
Residential demand leads the end-use mix, but hotel demand is projected to grow at 6.1%, faster than the overall market. Hotel buyers introduce a distinct decision logic: mattress selection must balance guest comfort with durability, procurement consistency, and replacement planning. This creates an opening for suppliers capable of offering repeatable specifications and account-level service rather than only consumer-facing product storytelling.
Key Restraints
Price thresholds and value comparison
The medium price range is the largest 2025 benchmark at 44.0%, while the high tier is projected to grow at 5.5%. The mix therefore supports premium growth but also signals a constraint: higher-priced materials or constructions must provide a sufficiently legible reason to trade up. Under the authorized structure, low is defined as under USD 500, medium as USD 500–USD 1,500, and high as above USD 1,500. Those wide bands can place highly differentiated products alongside more conventional alternatives, increasing the burden on brands to communicate why an upgrade matters.
Material and construction complexity
A diversified materials portfolio can improve relevance but complicates sourcing, quality control, inventory planning, and product education. Cotton, wool, bamboo, silk, polyester, and kapok-based offerings do not serve identical customer expectations or margin structures. A broad catalog without disciplined segmentation can create duplicative stock-keeping units and obscure the role of each product in the range.
The tactile evaluation gap
Offline specialized stores remain the largest channel benchmark at 35.0%, despite faster online growth. That pattern indicates that physical evaluation retains value, especially where firmness, surface feel, and perceived quality influence the purchase. Digital brands must therefore compensate for the absence of a showroom through clear configuration guidance, credible trial design, and fulfillment that does not make a return operationally prohibitive.
Concentrated geographic exposure
The United States represented 88.4% of North American market value in 2025, based on USD 688 million of the USD 778.2 million regional total. This concentration gives scale but ties regional performance closely to one national consumer and retail environment. Canada adds diversification, yet its USD 90.3 million 2025 value means that Canadian expansion must be economically selective rather than treated as a simple extension of a U.S. operating model.
GMI Analyst View
The central tension is that the category's most attractive growth avenues, including premium materials, softer comfort profiles, larger sizes, owned digital channels, and hotel demand, also raise execution requirements. They call for more exact product specification, better customer education, or more demanding fulfillment and account service. Growth will therefore favor businesses that can simplify the buying decision without oversimplifying the assortment.
The channel mix sharpens this tension. Specialized retail remains important because consumers value in-person evaluation, while company-owned websites offer the strongest projected growth. The implication is not a binary shift from store to screen. It is a need for a connected operating model in which showroom-led confidence, digital education, trial economics, and return management reinforce each other. Firms that use owned channels only for promotion may incur high customer-acquisition costs without solving the underlying comfort-selection risk.
North America Down Alternative Mattresses Market Segment Analysis
Material
Cotton leads the 2025 material benchmark at 37.2%, equivalent to an indicative USD 289.5 million when applied proportionally to the North American market. Polyester follows at 25.2%, or approximately USD 196.1 million on the same basis. Cotton's scale makes it the key volume platform; polyester provides a substantial value-oriented counterpart. Their combined weighting means material substitution between these two categories can materially influence category mix even when total market demand changes modestly.
Wool holds a 15.0% benchmark share and is projected to expand at 5.2%, while bamboo has a 10.0% share and the highest projected growth rate at 6.4%. These are the principal natural-material growth pools. Silk, at 6.0%, and other materials, including kapok, at 6.6%, occupy narrower positions. The commercial implication is that a material portfolio should distinguish scale products from higher-growth differentiation products; presenting all natural materials as interchangeable weakens the logic of the assortment.
Queen size leads with a 35.6% 2025 benchmark share, followed by full/double at 19.0% and twin/single at 17.0%. The leading size should therefore anchor production planning and merchandising depth. Larger formats grouped under "others," including king and California king, are projected to grow at 6.4%, faster than the market. Their momentum provides a route to value growth because a larger sleep surface can support higher absolute transaction values, provided the product proposition remains differentiated after delivery and setup costs are considered.
Price Range
The medium tier, defined in this market as USD 500–USD 1,500, is the largest price-range benchmark at 44.0%. It is the principal competitive battleground because it must satisfy consumers seeking a meaningful upgrade without crossing into a high-ticket purchase. The high tier, above USD 1,500, has a 31.0% benchmark share and is projected to grow at 5.5%, the fastest rate among price ranges. This creates a premium opportunity, but only for propositions that make material, construction, service, or comfort customization sufficiently tangible to support the price differential.
Firmness Level
Medium firmness holds a 46.2% benchmark share, confirming its role as the core volume configuration. Firm products account for 30.0%, while soft products account for 23.8% but are projected to grow at 5.1%. The combination favors a portfolio architecture with medium as the default, firm as a defined performance option, and soft as a targeted growth lever. Firms that make the softness proposition operationally clear can use it to differentiate without fragmenting the mainstream assortment.
End Use
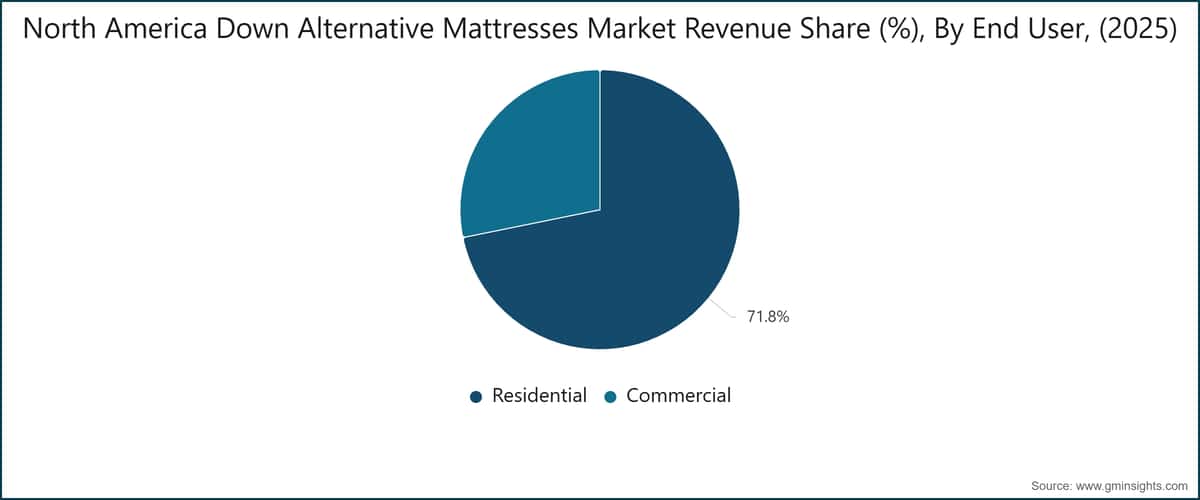
Residential purchasing represents 79.0% of the 2025 end-use benchmark and remains the category's primary demand base. Hotel demand, at 12.0%, has the strongest projected growth at 6.1%; hospital demand accounts for 5.0%, and other institutional uses account for 4.0%. Commercial requirements should not be approached as a scaled version of residential demand. Hotels, hospitals, and other institutions evaluate specifications through maintenance, consistency, purchasing cycles, and operational continuity as well as comfort.
Distribution Channel
Offline specialized stores lead the channel mix at 35.0%, while online e-commerce websites account for 28.0%. Company-owned websites represent only 12.0% but are projected to grow at 7.5%, ahead of e-commerce websites at 6.2%. The resulting mix supports a dual-channel strategy: specialist stores remain useful for fit and confidence, whereas owned digital channels provide the strongest route for product education, customer-data capture, and margin control. Hypermarkets/supermarkets, at 10.0%, and other retail stores, at 15.0%, remain relevant for accessibility but are less suited to complex premium positioning.
GMI Analyst View
Segment performance points to a market in which value creation is moving toward combinations rather than isolated attributes. Bamboo's growth rate, the expansion of larger sizes, the acceleration of high-price products, soft-firmness momentum, hotel demand, and company-owned websites each matter individually. Their greater significance is cumulative: the most attractive offers are likely to combine a differentiated material story with a comfort configuration, a premium size or service proposition, and a channel that can explain the package effectively.
This does not make the category uniformly premium. Cotton, polyester, medium price points, medium firmness, residential demand, and specialized retail remain the scale foundation. The strategic task is to preserve that foundation while selectively investing in the combinations that lift realized value. A brand that adds premium materials without refining digital guidance, merchandising, or assortment roles may absorb complexity without capturing the mix benefit.
North America Down Alternative Mattresses Market Regional Analysis
United States
The United States generated USD 688 million in 2025, equal to 88.4% of the North American market, and is projected to reach approximately USD 1.04 billion by 2035 at a 4.2% CAGR. It is therefore the region's decisive market for scale, channel design, and competitive visibility. Its size supports a broad range of product configurations and makes it the natural testing ground for material, firmness, and direct-to-consumer propositions before wider regional deployment.
The U.S. market's concentration also means that national execution has an outsized effect on regional results. The large residential base favors repeatable core assortments, while digital growth and specialist retail coexistence reward brands that can align online selection tools with physical product experience. Suppliers should prioritize operational consistency across high-volume queen and medium-firmness configurations while using premium material and larger-size offerings to raise mix selectively.
Canada
Canada represented USD 90.3 million in 2025. Its smaller scale does not make it commercially negligible; it provides a distinct regional route for brands seeking North American presence beyond the United States. However, the market's size argues against simply replicating every U.S. product and channel investment. An economically viable Canadian offer requires disciplined selection of sizes, materials, price points, and fulfillment arrangements.
Canada's role is best understood as a focused extension market rather than an undifferentiated second U.S. market. Brands that enter with a limited, well-defined range can preserve clarity and reduce inventory exposure. The appropriate product mix will depend on whether the brand's advantage rests on specialist retail support, a company-owned digital experience, or commercial account coverage.
GMI Analyst View
North American growth is geographically concentrated but not geographically uniform. The United States supplies the scale needed to absorb product innovation and supports the regional forecast, while Canada offers a smaller but relevant expansion vector. This creates an asymmetric planning problem: a U.S.-first strategy is commercially rational, yet overdependence on one market makes the regional forecast sensitive to U.S. channel execution and replacement demand.
The best response is selective replication rather than automatic standardization. Core products should be designed for operational efficiency across the region, but Canada should receive an assortment and fulfillment model calibrated to its smaller revenue base. That approach can protect contribution economics while retaining a second national platform for brand development and commercial relationships.
North America Down Alternative Mattresses Market Share & Competitive Landscape
Tempur Sealy International leads the 2025 market with an estimated 15% share. Together with Serta Simmons Bedding, Sleep Number Corporation, Purple Innovation, and Casper Sleep, the top five players collectively hold approximately 52% of the market. The concentrated top-five share of approximately 52% underscores the role of scaled operators in the category, with e-commerce and material-led brands competing for incremental share.
The reported 2025 share values in this table are drawn from GMI market research.
Competitive advantage in this market depends on more than the number of models offered. The leading commercial challenge is to make material, comfort, and price positioning intelligible across both physical and digital routes to market. Companies with a coherent range architecture can maintain clearer differentiation between scale products and higher-value offerings; companies with undifferentiated assortments face greater price comparison risk.
Recent Industry Developments
Purchase regional analysis, country-level analysis, company profiles, or any other segment-level insights separately
based on your research needs.
Frequently Asked Question(FAQ) :
Research methodology, data sources & validation process
This report draws on a structured research process built around direct industry conversations, proprietary modelling, and rigorous cross-validation and not just desk research.
Our 6-step research process
1. Research design & analyst oversight
At GMI, our research methodology is built on a foundation of human expertise, rigorous validation, and complete transparency. Every insight, trend analysis, and forecast in our reports is developed by experienced analysts who understand the nuances of your market.
Our approach integrates extensive primary research through direct engagement with industry participants and experts, complemented by comprehensive secondary research from verified global sources. We apply quantified impact analysis to deliver dependable forecasts, while maintaining complete traceability from original data sources to final insights.
2. Primary research
Primary research forms the backbone of our methodology, contributing nearly 80% to overall insights. It involves direct engagement with industry participants to ensure accuracy and depth in analysis. Our structured interview program covers regional and global markets, with inputs from C-suite executives, directors, and subject matter experts. These interactions provide strategic, operational, and technical perspectives, enabling well-rounded insights and reliable market forecasts.
3. Data mining & market analysis
Data mining is a key part of our research process, contributing nearly 20% to the overall methodology. It involves analysing market structure, identifying industry trends, and assessing macroeconomic factors through revenue share analysis of major players. Relevant data is collected from both paid and unpaid sources to build a reliable database. This information is then integrated to support primary research and market sizing, with validation from key stakeholders such as distributors, manufacturers, and associations.
4. Market sizing
Our market sizing is built on a bottom-up approach, starting with company revenue data gathered directly through primary interviews, alongside production volume figures from manufacturers and installation or deployment statistics. These inputs are then pieced together across regional markets to arrive at a global estimate that stays grounded in actual industry activity.
5. Forecast model & key assumptions
Every forecast includes explicit documentation of:
✓ Key growth drivers and their assumed impact
✓ Restraining factors and mitigation scenarios
✓ Regulatory assumptions and policy change risk
✓ Technology adoption curve parameter
✓ Macroeconomic assumptions (GDP growth, inflation, currency)
✓ Competitive dynamics and market entry/exit expectations
6. Validation & quality assurance
The final stages involve human validation, where domain experts manually review filtered data to identify nuances and contextual errors that automated systems might miss. This expert review adds a critical layer of quality assurance, ensuring data aligns with research objectives and domain-specific standards.
Our triple-layer validation process ensures maximum data reliability:
✓ Statistical Validation
✓ Expert Validation
✓ Market Reality Check
Trust & credibility
Verified data sources
Trade publications
Industry journals, trade publications, and specialized media.
Industry databases
Proprietary and third-party market databases
Regulatory filings
Government procurement records and policy documents
Academic research
University studies and specialist institution reports
Company reports
Annual reports, investor presentations, and filings
Expert interviews
C-suite, procurement leads, and technical specialists
GMI archive
13,000+ published studies across 20+ industry verticals
Trade data
Import/export volumes, HS codes, and customs records
Parameters studied & evaluated
Every data point in this report is validated through primary interviews, true bottom-up modelling, and rigorous cross-checks. Read about our research process →