Market Size, By Power Rating (≤ 75 kVA, > 75 kVA - 375 kVA, > 375 kVA - 750 kVA, > 750 kVA), By Fuel (Diesel, Gas, Others), By End Use (Telecom, Data center, Healthcare, Oil & gas, Electric utilities, Offshore, Manufacturing, Construction, Mining, Marine, Others), and By Application (Standby, Peak shaving, Prime/continuous). The market forecasts are provided in terms of revenue (USD Million).
Report ID: GMI1321
|
Published Date: April 2026
|
Report Format: PDF
Download Free PDF
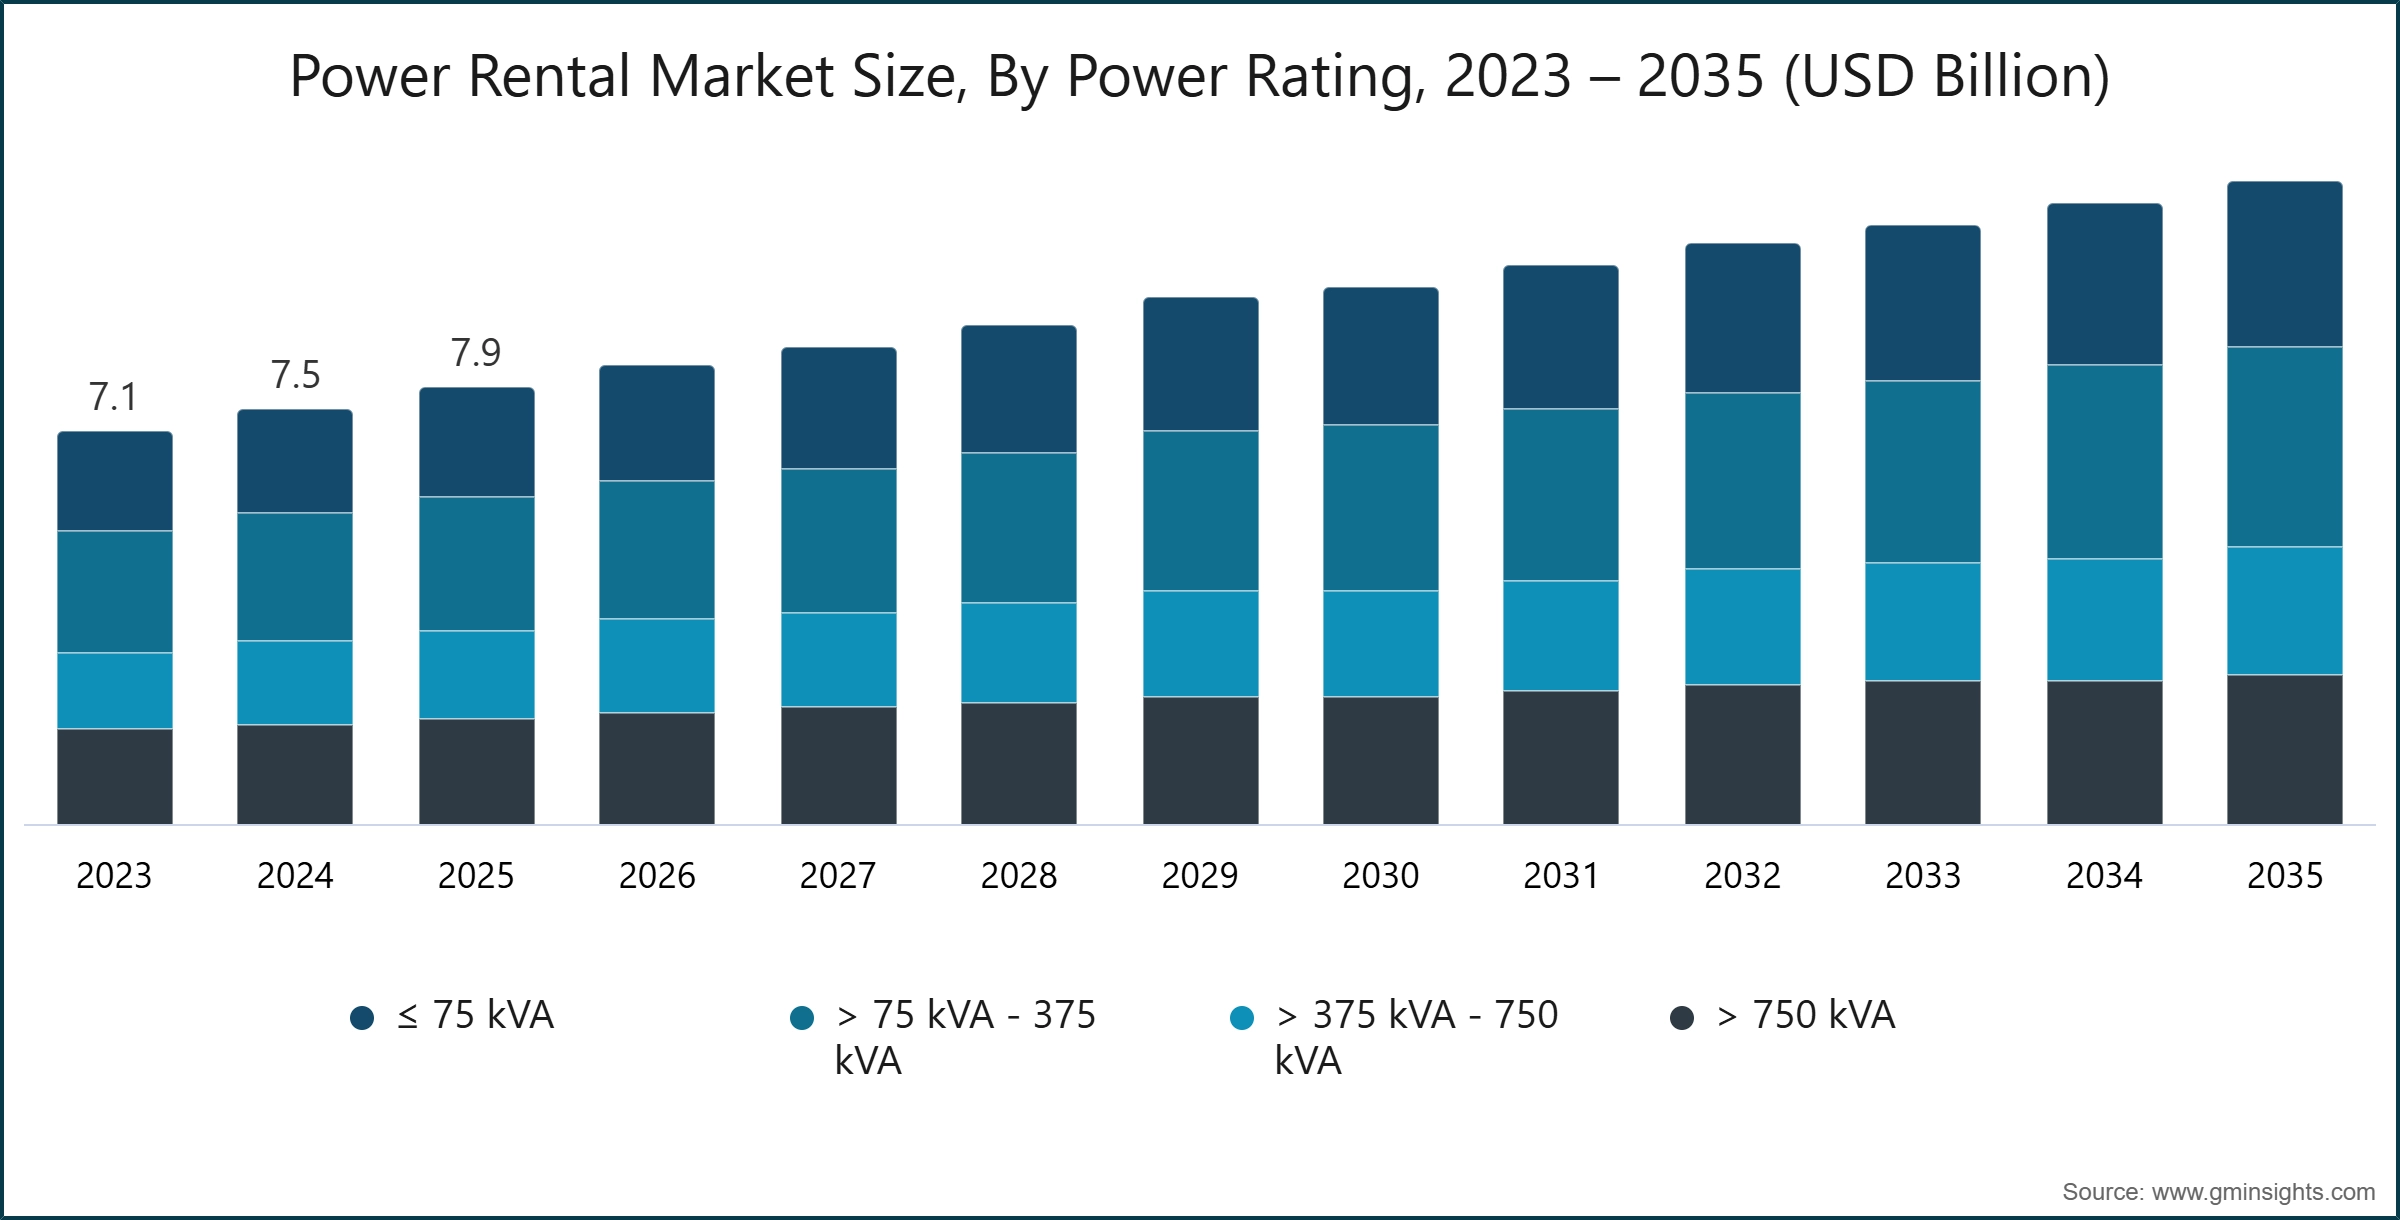
Power Rental Market Size
The global power rental market was estimated at USD 7.9 billion in 2025. The market is expected to grow from USD 8.2 billion in 2026 to USD 11.5 billion by 2035, at a CAGR of 3.8%, according to a recent study by Global Market Insights Inc.
The rapid growth of data centers & escalating costs of unplanned outages in line with the heavy reliance on information sharing and constant communication is significantly driving the rental demand for gensets. Natural disasters including windstorms, tsunamis, and hurricanes are major events that account for most electricity outages, stimulating the product penetration.
The power rental option is flexible and cost-effective in meeting the power requirements of businesses in different fields. Businesses require genset rental services in case of scheduled or unscheduled power outages or in meeting the power demand in case of specific events. The rental generator sets are attractive options for businesses in the sense that the power requirement can be easily scaled up in response to business needs.
For instance, according to the 2025 Data Center Power Report, a significant percentage of newly developed data centers is re-evaluating their power strategies in the face of increasing grid constraints. Almost 30 percent of newly developed data centers will be using on-site power generation as a primary or secondary power source. This shift is driven by grid instability, capacity limitations, and prolonged interconnection timelines.
Power Rental Market Trends
Rising consumer awareness and the growing need for high reliability and uninterrupted operations are fueling demand for power rental equipment. Population growth and improving living standards in line with a strong real estate industry expansion, are positively influencing the industry growth. Increasing infrastructure spending in conjunction with the rapid expansion of manufacturing capacities is creating new business opportunities. Moreover, supportive government initiatives and funding aimed at developing industrial facilities will accelerate the adoption of these solutions.
Power Rental Market Analysis
The >75 kVA–375 kVA segment of the power rental market is projected to exceed USD 3.5 billion by 2035. Increasing demand for data centers due to increased data usage through social media sites, e-commerce sites, smartphones, and government initiatives will act as a driving force for these units. The main government initiatives for digitalization will increase industry metrics. The continuous adoption of innovative models for sustaining growth along with the with a focus on operational excellence will increase the business landscape.
The diesel segment accounted for a 71.2% share of the power rental market in 2025. Ongoing digitization combined with the expansion of data centers especially in developing countries will significantly increase the demand for reliable power generation sources. The expansion of online services in the remote regions has also led to an encouraging business environment. Extensive investments by public & private entities to expand data center infrastructure are driving demand for rental generator sets. The data center industry is experiencing substantial growth owing to challenges including startup issues, system downtimes, and potential loss of in-process data, driving the business potential.
U.S. power rental market was valued at USD 4.3 billion in 2025. The government’s growing emphasis on raising electrification rates is set to boost the use of these units. The industry will be driven by continuous upgrade requirements to old grid infrastructure and the increasing occurrence of weather-related disruptions. In addition, the rising cost of data center outages, as well as the growing demand from consumers for reliable backup power systems, will drive the industry.
For instance, in 2025, severe weather incidents such as windstorms, floods, and extreme winter conditions put additional stress on regional power infrastructure. These incidents resulted in large-scale electricity outages affecting hundreds of thousands of customers in the U.S. Pacific Northwest and other vulnerable areas. These incidents highlighted the rising vulnerability of aging power infrastructure to climate-related risks.
The growth of residential buildings, educational institutions, and retail complexes has notably boosted the demand for a stable power supply will augment the Asia Pacific market. Rising needs for power solutions that offer rapid, automatic start-up and high reliability are expected to further drive the use of these units. Additionally, the increasing investments across construction sector and increasing reliance on these generators to meet substantial power demands for continuous operation of equipment and tools at job sites will strengthen the business landscape.
Power Rental Market Share
The players operating across the industry has developed several strategies to remain competitive in the industry. For instance, the industry players have been able to expand the service portfolio, which has led to customer satisfaction. Additionally, the industry players have been able to expand geographically to emerging markets, where there has been a high demand for infrastructure. Collaborations with big companies in the construction, industrial, and energy sectors have also helped the industry players increase market share.
Power Rental Market Companies
Major players operating in the power rental industry are:
Aggreko
Al Faris Group
Atlas Copco
APR Energy
Bredenoord
Byrne Equipment Rental
Caterpillar
Cummins
Energyst
Generac Power Systems
GMMCO Limited
Herc Rentals
HIMOINSA
Modern Hiring Service
PR Industrial
Perennial Technologies
Perfect Hiring Services
Rehlko
Shenton Group
Sudhir Power
United Rentals
Wagner Equipment
Power Rental Industry News
In December 2025, Cummins consolidated its position as a market leader in the field of power technologies with the launch of its next-generation portfolio at EXCON 2025. This includes the launch of a new CPCB IV+ compliant genset with a rating of 82.5 kVA. This product is designed to deliver efficient, reliable, and clean power to infrastructure development, construction, and mining sites. Cummins India is launching future-ready engines and emission solutions to provide maximum uptime and lower cost of ownership.
In June 2025, Aggreko announced the launch of three new natural gas generator sets. This will increase Aggreko’s range of low-carbon power rental solutions. The launch comprises a 350 kW unit and two 1500 kW units, one of which is a quick-deployment trailer-mounted unit for flexible site applications. These generators are intended to enable customers to achieve improved efficiency and lower emissions while reducing their fuel bills.
The power rental market research report includes in-depth coverage of the industry with estimates & forecast in terms of revenue (USD Million) from 2022 to 2035, for the following segments:
Market, By Power Rating
≤ 75 kVA
> 75 kVA - 375 kVA
> 375 kVA - 750 kVA
> 750 kVA
Market, By Fuel
Diesel
Gas
Others
Market, By End Use
Telecom
Data center
Healthcare
Oil & gas
Electric utilities
Offshore
Manufacturing
Construction
Mining
Marine
Others
Market, By Application
Standby
Peak shaving
Prime/continuous
The above information has been provided for the following regions and countries:
North America
U.S.
Canada
Europe
Russia
UK
Germany
France
Spain
Austria
Italy
Asia Pacific
China
Australia
India
Japan
South Korea
Indonesia
Malaysia
Thailand
Vietnam
Philippines
Middle East
Saudi Arabia
UAE
Qatar
Turkey
Iran
Oman
Africa
Egypt
Nigeria
Algeria
South Africa
Angola
Kenya
Mozambique
Latin America
Brazil
Mexico
Argentina
Chile
Authors: Ankit Gupta, Shubham Chaudhary
Power Rental Market Scope
Power Rental Market Size
Power Rental Market Trends
Power Rental Market Analysis
Power Rental Market Share
Report Content
Chapter 1 Methodology & Scope
1.1 Research approach
1.2 Quality commitments
1.2.1 GMI AI policy & data integrity commitment
1.2.1.1 Source consistency protocol
1.3 Research trail & confidence scoring
1.3.1 Research trail components
1.3.2 Scoring components
1.4 Data collection
1.4.1 Partial list of primary sources
1.5 Data mining sources
1.5.1 Paid sources
1.5.1.1 Sources, by region
1.6 Base estimates and calculations
1.6.1 Base year calculation for any one approach
1.7 Market estimates & forecasts parameters
1.8 Forecast model
1.8.1 Quantified market impact analysis
1.8.1.1 Mathematical impact of growth parameters on forecast
1.9 Research transparency addendum
1.9.1 Source attribution framework
1.9.2 Quality assurance metrics
1.9.3 Our commitment to trust
1.10 Market definitions
Chapter 2 Executive Summary
2.1 Industry synopsis, 2022 - 2035
2.1.1 Business trends
2.1.2 Power rating trends
2.1.3 fuel trends
2.1.4 End use trends
2.1.5 Application trends
2.1.6 Regional trends
Chapter 3 Industry Insights
3.1 Industry ecosystem analysis
3.1.1 Raw material availability & sourcing analysis
3.1.2 Manufacturing capacity assessment
3.1.3 Supply chain resilience & risk factors
3.1.4 Distribution network analysis
3.2 Industry impact forces
3.2.1 Growth drivers
3.2.2 Industry pitfalls & challenges
3.3 Regulatory landscape
3.4 Growth potential analysis
3.5 Porter's analysis
3.5.1 Bargaining power of suppliers
3.5.2 Bargaining power of buyers
3.5.3 Threat of new entrants
3.5.4 Threat of substitutes
3.6 PESTEL analysis
3.6.1 Political factors
3.6.2 Economic factors
3.6.3 Social factors
3.6.4 Technological factors
3.6.5 Legal factors
3.6.6 Environmental factors
3.7 Cost structure analysis of power rental
3.8 Emerging opportunities & trends
3.9 Digitalization & IoT integration
3.10 Growth in untapped markets & applications
3.11 Investment analysis & future prospects
3.12 Impact of AI & Generative AI on the market (Core Solution)
3.12.1 AI-Driven production optimization (Core Solution)
4.2 Company market share analysis, by region, 2025
4.2.1 North America
4.2.2 Europe
4.2.3 Asia Pacific
4.2.4 Middle East
4.2.5 Africa
4.2.6 Latin America
4.3 Competitive positioning matrix
4.4 Key developments
4.4.1 Mergers & acquisitions
4.4.2 Partnerships & collaborations
4.4.3 New product launches
4.4.4 Expansion plans & funding
Chapter 5 Market Size and Forecast, By Power Rating, 2022 - 2035 (USD Million)
5.1 Key trends
5.2 ≤ 75 kVA
5.3 > 75 kVA - 375 kVA
5.4 > 375 kVA - 750 kVA
5.5 > 750 kVA
Chapter 6 Market Size and Forecast, By Fuel, 2022 - 2035 (USD Million)
6.1 Key trends
6.2 Diesel
6.3 Gas
6.4 Others
Chapter 7 Market Size and Forecast, By End Use, 2022 - 2035 (USD Million)
7.1 Key trends
7.2 Telecom
7.3 Data center
7.4 Healthcare
7.5 Oil & gas
7.6 Electric utilities
7.7 Offshore
7.8 Manufacturing
7.9 Construction
7.10 Mining
7.11 Marine
7.12 Others
Chapter 8 Market Size and Forecast, By Application, 2022 - 2035 (USD Million)
8.1 Key trends
8.2 Standby
8.3 Peak shaving
8.4 Prime/continuous
Chapter 9 Market Size and Forecast, By Region, 2022 - 2035 (USD Million)
9.1 Key trends
9.2 North America
9.2.1 U.S.
9.2.2 Canada
9.3 Europe
9.3.1 Russia
9.3.2 UK
9.3.3 Germany
9.3.4 France
9.3.5 Spain
9.3.6 Austria
9.3.7 Italy
9.4 Asia Pacific
9.4.1 China
9.4.2 Australia
9.4.3 India
9.4.4 Japan
9.4.5 South Korea
9.4.6 Indonesia
9.4.7 Malaysia
9.4.8 Thailand
9.4.9 Vietnam
9.4.10 Philippines
9.5 Middle East
9.5.1 Saudi Arabia
9.5.2 UAE
9.5.3 Qatar
9.5.4 Turkey
9.5.5 Iran
9.5.6 Oman
9.6 Africa
9.6.1 Egypt
9.6.2 Nigeria
9.6.3 Algeria
9.6.4 South Africa
9.6.5 Angola
9.6.6 Kenya
9.6.7 Mozambique
9.7 Latin America
9.7.1 Brazil
9.7.2 Mexico
9.7.3 Argentina
9.7.4 Chile
Chapter 10 Company Profiles
10.1 Aggreko
10.2 Al Faris Group
10.3 Atlas Copco
10.4 APR Energy
10.5 Bredenoord
10.6 Byrne Equipment Rental
10.7 Caterpillar
10.8 Cummins
10.9 Energyst
10.10 Generac Power Systems
10.11 GMMCO Limited
10.12 Herc Rentals
10.13 HIMOINSA
10.14 Modern Hiring Service
10.15 PR Industrial S.r.l
10.16 Perennial Technologies
10.17 Perfect Hiring Services
10.18 Rehlko
10.19 Shenton Group
10.20 Sudhir Power
10.21 United Rentals
10.22 Wagner Equipment
Don't see your key competitors?
The companies listed in this report are a curated selection - not the full competitive universe.
Our market revenue calculations use a bottom-up methodology that accounts for all players across all regions - including manufacturers, distributors, and specialists not individually profiled. The profiles section spotlights strategically significant players; it does not define the scope of our market sizing.
Your competitive landscape may also include
Regional or domestic-only leaders not in the global top tier
Distributors and channel partners who control market access
Emerging disruptors, startups, or adjacent-industry entrants
Niche players focused on a specific application or end-use
Free customization - up to 20% of report value
Need specific data? Request customization and get the insights tailored to your exact requirements.
Authors: Ankit Gupta, Shubham Chaudhary
For inquiries regarding discounts, bulk purchases, or customization requests, please contact us at[email protected]
Explore our licensing options:
Starting at: $2,450
Premium Report Details
Base Year: 2025
Companies Profiled: 22
Tables and Figures: 48
Countries covered: 36
Pages: 180
Download Free PDF
Premium Report Details
Base Year: 2025
Companies Profiled: 22
Tables and Figures: 48
Countries covered: 36
Pages: 180
Download Free PDF
Share Content
Add Citations
Ankit Gupta. 2026, April. Power Rental Market Size - By Power Rating, By Fuel, By End Use, By Application, Analysis, Share, Growth Forecast, 2026 – 2035 (Report ID: GMI1321). Global Market Insights Inc. Retrieved July 2, 2026, from https://www.gminsights.com/toc/details/power-rental-market
Power Rental Market
Get a free sample of this report
Get a free sample of this report Power Rental Market
Is your requirement urgent? Please give us your business email for a speedy delivery!


Power Rental Market Size
The global power rental market was estimated at USD 7.9 billion in 2025. The market is expected to grow from USD 8.2 billion in 2026 to USD 11.5 billion by 2035, at a CAGR of 3.8%, according to a recent study by Global Market Insights Inc.
The rapid growth of data centers & escalating costs of unplanned outages in line with the heavy reliance on information sharing and constant communication is significantly driving the rental demand for gensets. Natural disasters including windstorms, tsunamis, and hurricanes are major events that account for most electricity outages, stimulating the product penetration.
The power rental option is flexible and cost-effective in meeting the power requirements of businesses in different fields. Businesses require genset rental services in case of scheduled or unscheduled power outages or in meeting the power demand in case of specific events. The rental generator sets are attractive options for businesses in the sense that the power requirement can be easily scaled up in response to business needs.
For instance, according to the 2025 Data Center Power Report, a significant percentage of newly developed data centers is re-evaluating their power strategies in the face of increasing grid constraints. Almost 30 percent of newly developed data centers will be using on-site power generation as a primary or secondary power source. This shift is driven by grid instability, capacity limitations, and prolonged interconnection timelines.
Power Rental Market Trends
Rising consumer awareness and the growing need for high reliability and uninterrupted operations are fueling demand for power rental equipment. Population growth and improving living standards in line with a strong real estate industry expansion, are positively influencing the industry growth. Increasing infrastructure spending in conjunction with the rapid expansion of manufacturing capacities is creating new business opportunities. Moreover, supportive government initiatives and funding aimed at developing industrial facilities will accelerate the adoption of these solutions.
Power Rental Market Analysis
The >75 kVA–375 kVA segment of the power rental market is projected to exceed USD 3.5 billion by 2035. Increasing demand for data centers due to increased data usage through social media sites, e-commerce sites, smartphones, and government initiatives will act as a driving force for these units. The main government initiatives for digitalization will increase industry metrics. The continuous adoption of innovative models for sustaining growth along with the with a focus on operational excellence will increase the business landscape.
The diesel segment accounted for a 71.2% share of the power rental market in 2025. Ongoing digitization combined with the expansion of data centers especially in developing countries will significantly increase the demand for reliable power generation sources. The expansion of online services in the remote regions has also led to an encouraging business environment. Extensive investments by public & private entities to expand data center infrastructure are driving demand for rental generator sets. The data center industry is experiencing substantial growth owing to challenges including startup issues, system downtimes, and potential loss of in-process data, driving the business potential.
U.S. power rental market was valued at USD 4.3 billion in 2025. The government’s growing emphasis on raising electrification rates is set to boost the use of these units. The industry will be driven by continuous upgrade requirements to old grid infrastructure and the increasing occurrence of weather-related disruptions. In addition, the rising cost of data center outages, as well as the growing demand from consumers for reliable backup power systems, will drive the industry.
For instance, in 2025, severe weather incidents such as windstorms, floods, and extreme winter conditions put additional stress on regional power infrastructure. These incidents resulted in large-scale electricity outages affecting hundreds of thousands of customers in the U.S. Pacific Northwest and other vulnerable areas. These incidents highlighted the rising vulnerability of aging power infrastructure to climate-related risks.
The growth of residential buildings, educational institutions, and retail complexes has notably boosted the demand for a stable power supply will augment the Asia Pacific market. Rising needs for power solutions that offer rapid, automatic start-up and high reliability are expected to further drive the use of these units. Additionally, the increasing investments across construction sector and increasing reliance on these generators to meet substantial power demands for continuous operation of equipment and tools at job sites will strengthen the business landscape.
Power Rental Market Share
The players operating across the industry has developed several strategies to remain competitive in the industry. For instance, the industry players have been able to expand the service portfolio, which has led to customer satisfaction. Additionally, the industry players have been able to expand geographically to emerging markets, where there has been a high demand for infrastructure. Collaborations with big companies in the construction, industrial, and energy sectors have also helped the industry players increase market share.
Power Rental Market Companies
Major players operating in the power rental industry are:
Aggreko
Al Faris Group
Atlas Copco
APR Energy
Bredenoord
Byrne Equipment Rental
Caterpillar
Cummins
Energyst
Generac Power Systems
GMMCO Limited
Herc Rentals
HIMOINSA
Modern Hiring Service
PR Industrial
Perennial Technologies
Perfect Hiring Services
Rehlko
Shenton Group
Sudhir Power
United Rentals
Wagner Equipment
Power Rental Industry News
In December 2025, Cummins consolidated its position as a market leader in the field of power technologies with the launch of its next-generation portfolio at EXCON 2025. This includes the launch of a new CPCB IV+ compliant genset with a rating of 82.5 kVA. This product is designed to deliver efficient, reliable, and clean power to infrastructure development, construction, and mining sites. Cummins India is launching future-ready engines and emission solutions to provide maximum uptime and lower cost of ownership.
In June 2025, Aggreko announced the launch of three new natural gas generator sets. This will increase Aggreko’s range of low-carbon power rental solutions. The launch comprises a 350 kW unit and two 1500 kW units, one of which is a quick-deployment trailer-mounted unit for flexible site applications. These generators are intended to enable customers to achieve improved efficiency and lower emissions while reducing their fuel bills.
The power rental market research report includes in-depth coverage of the industry with estimates & forecast in terms of revenue (USD Million) from 2022 to 2035, for the following segments:
Market, By Power Rating
≤ 75 kVA
> 75 kVA - 375 kVA
> 375 kVA - 750 kVA
> 750 kVA
Market, By Fuel
Diesel
Gas
Others
Market, By End Use
Telecom
Data center
Healthcare
Oil & gas
Electric utilities
Offshore
Manufacturing
Construction
Mining
Marine
Others
Market, By Application
Standby
Peak shaving
Prime/continuous
The above information has been provided for the following regions and countries:
North America
U.S.
Canada
Europe
Russia
UK
Germany
France
Spain
Austria
Italy
Asia Pacific
China
Australia
India
Japan
South Korea
Indonesia
Malaysia
Thailand
Vietnam
Philippines
Middle East
Saudi Arabia
UAE
Qatar
Turkey
Iran
Oman
Africa
Egypt
Nigeria
Algeria
South Africa
Angola
Kenya
Mozambique
Latin America
Brazil
Mexico
Argentina
Chile