Magnetic Resonance Imaging Systems Market Size & Share 2026-2035
Market Size By Architecture (Open system, Closed system), By Field Strength (Low field strength, Mid field strength, High field strength), By Design (Fixed MRI system, Portable MRI system), By Application (Oncology, Neurology, Musculoskeletal, Vascular, Gastroenterology, Cardiology, Other applications), By End use (Hospitals, Imaging centers, Ambulatory surgical centers, Other end users). The market forecasts are provided in terms of value (USD).
Report ID: GMI2140
|
Published Date: April 2026
|
Report Format: PDF
Download Free PDF
Magnetic Resonance Imaging Systems Market Size
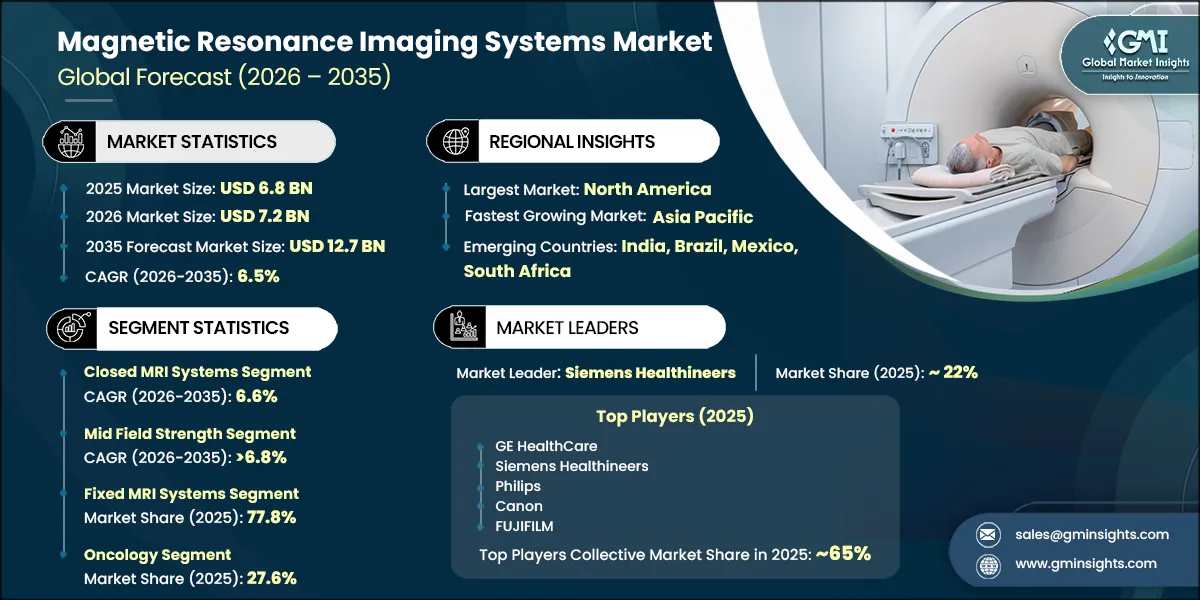
The global magnetic resonance imaging systems market was valued at USD 6.8 billion in 2025 and is projected to grow from 7.2 billion in 2026 to USD 12.7 billion by 2035, expanding at a CAGR of 6.5%, according to the latest report published by Global Market Insights Inc.
The market growth is driven by numerous factors, such as increasing chronic disease prevalence globally, rising awareness pertaining to early diagnosis, among other contributing factors.
Magnetic resonance imaging (MRI) systems are advanced diagnostic imaging technologies that use strong magnetic fields, radiofrequency waves, and sophisticated computer processing to generate high‑resolution images of internal body structures. By exploiting the magnetic properties of hydrogen atoms in biological tissues, MRI systems enable detailed visualization of soft tissues without the use of ionizing radiation. This makes MRI a critical tool for detecting, diagnosing, and monitoring a wide range of medical conditions with high contrast and spatial accuracy.
Increasing number of accidents is expected to fuel the industry's growth. GE HealthCare, Siemens Healthineers, Philips, Canon, and FUJIFILM are among the leading players operating in the market. These players mainly focus on service innovation, geographic expansion, research and development, and collaboration with local or regional healthcare providers, among other factors.
The rising global burden of chronic diseases is a major driver for the magnetic resonance imaging systems market, as these conditions require advanced, high‑resolution diagnostic imaging for early detection, disease monitoring, and treatment planning. According to the World Health Organization (WHO), noncommunicable diseases account for approximately 74–75% of all global deaths annually, equivalent to around 41 million deaths per year, underscoring the scale and persistence of chronic illness worldwide. Furthermore, WHO projections indicate that by 2050, chronic diseases could account for up to 86% of all global deaths, driven by aging populations and increasing disease prevalence, reinforcing sustained demand for MRI systems across neurology, oncology, cardiology, and musculoskeletal imaging as healthcare systems expand diagnostic capacity to manage long‑term chronic conditions.
Additionally, the expanding elderly population globally is fueling demand for MRI systems, as age-related and chronic health conditions become increasingly common. MRI technology, known for its non-invasive nature and precise imaging, is crucial for diagnosing and monitoring health issues prevalent among older adults, such as cardiovascular diseases, cancer, neurological disorders, and musculoskeletal conditions. The WHO projects that by 2050, the number of individuals aged 80 and above will triple, with a significant portion residing in low- and middle-income countries. In the U.S., nearly 95% of adults over 60 manage at least one chronic condition, and the number of people aged 65 and older is expected to reach 80.8 million by 2060. This demographic trend, characterized by a high rate of multiple chronic conditions, underscores the necessity for advanced diagnostics such as MRI to address complex health needs. Therefore, the demand for MRI systems continues to rise to improve diagnostic precision and support healthcare management for the aging population.
Magnetic Resonance Imaging Systems Market Trends
Rapid technological advancements in magnetic resonance imaging (MRI) systems have emerged as a critical growth driver of the MRI systems market, enabling faster scan times, superior image resolution, and improved patient comfort while expanding MRI applicability across neurology, oncology, cardiology, orthopedics, and abdominal imaging.
Next‑generation MRI platforms integrating AI‑powered reconstruction, compressed sensing, and advanced coil architectures are transforming traditional imaging workflows, allowing clinicians to perform comprehensive multi‑anatomy exams within a single session. For example, Philips’ Ingenia Elition 3.0T leverages SmartSpeed AI and Compressed SENSE to deliver up to 50% faster scans with improved spatial resolution, while enhancing patient experience through touchless guided setup and immersive audiovisual environments.
Ultra‑high‑performance 3T systems and scalable digital architectures are redefining precision standards in diagnostic MRI, particularly for complex neurological, oncological, and musculoskeletal applications. Siemens Healthineers’ MAGNETOM Vida utilizes BioMatrix technology, ultra‑high‑density coils, and automated patient‑adaptive sensing to reduce rescans, improve reproducibility, and support advanced techniques such as free‑breathing abdominal imaging and accelerated diffusion studies.
Emerging ultra‑high‑field MRI technologies are expanding clinical frontiers beyond conventional imaging, particularly in neurological disorders. Clinical adoption of 7‑Tesla MRI systems, such as Siemens Healthineers’ MAGNETOM Terra, is enabling unprecedented visualization of microvascular structures and disease‑specific biomarkers in conditions including epilepsy, multiple sclerosis, and neurodegenerative diseases, supporting earlier diagnosis and precision medicine approaches.
Collectively, these technological advances are expanding MRI clinical indications, accelerating replacement of legacy systems, and reinforcing MRI as an indispensable diagnostic modality, driving sustained capital investment by hospitals and imaging centers and supporting long‑term growth of the market.
Magnetic Resonance Imaging Systems Market Analysis
Based on architecture, the MRI systems market is bifurcated into open system and closed system. The closed MRI systems segment is projected to grow at a 6.6% CAGR throughout the forecast period. This growth is driven by ongoing technological improvements in closed MRI platforms, such as wider bore designs, enhanced patient ergonomics, and faster scan protocols. The segment is expected to reach USD 12.2 billion by 2035.
Closed MRI systems, characterized by their fully enclosed architecture, deliver superior image quality by minimizing external interference and reducing motion artifacts, making them highly effective for high‑resolution imaging and accurate clinical diagnostics.
The strong clinical versatility of closed MRI systems is driving adoption across a wide range of applications, including neurology, musculoskeletal imaging, oncology, and cardiovascular diagnostics, where image precision and consistency are critical.
As healthcare providers continue to prioritize advanced diagnostic accuracy and comprehensive imaging capabilities, demand for closed MRI systems is expected to increase steadily, positioning this segment for substantial growth over the forecast period.
The open system segment held a significant share in the market with revenue of USD 249.9 million in 2025. Growth is driven by increasing preference for patient-friendly imaging solutions, particularly for claustrophobic, pediatric, and obese patients. Open MRI systems offer improved comfort, easier accessibility, and better patient compliance, making them widely adopted in outpatient imaging centers and specialized diagnostic facilities.
Based on field strength, the magnetic resonance imaging systems market is bifurcated into low field strength, mid field strength, and high field strength. The mid field strength segment is projected to expand at 6.8% CAGR to reach USD 5.7 billion by 2035.
Growth is supported by its balanced offering of image quality and cost-effectiveness, making it suitable for a wide range of routine diagnostic applications. These systems are widely adopted in hospitals and diagnostic centers seeking reliable performance without the higher costs associated with high-field MRI systems.
In 2025, the high field strength MRI segment captured a revenue share of 36.8%, a trend expected to continue in the coming years. High‑field strength MRI systems, typically operating at 1.5 Tesla and above, continue to command strong market preference due to their ability to deliver superior image resolution and higher signal‑to‑noise ratios, which are critical for precise and reliable diagnostic outcomes.
Continuous technological advancements in high‑field MRI systems have addressed traditional challenges such as image distortion and prolonged scan durations, resulting in improved workflow efficiency and enhanced patient throughput.
With the growing demand for detailed, multi‑parametric imaging across diverse clinical applications, including neurology, oncology, cardiology, and musculoskeletal diagnostics, the high‑field strength MRI segment is well positioned to sustain its dominant revenue share in the global MRI systems market over the foreseeable future.
The low field strength segment is projected to expand at 6.1% CAGR to reach USD 2.4 billion by 2035. Adoption is driven by lower installation and operational costs, as well as reduced infrastructure requirements. These systems are particularly useful in smaller healthcare facilities and emerging markets where affordability and accessibility are key considerations.
Based on design, the magnetic resonance imaging systems market is bifurcated into portable MRI systems and fixed MRI systems. In 2025, the fixed MRI systems segment captured a revenue share of 77.8%. The fixed MRI systems segment is projected to expand at 6.3% CAGR to reach USD 9.7 billion by 2035.
Fixed MRI systems constitute the core segment of the magnetic resonance imaging (MRI) systems market, accounting for the majority of installations globally due to their comprehensive clinical capabilities and compatibility with high‑, mid‑, and select low‑field configurations.
Fixed MRI systems remain essential for tertiary care hospitals and advanced diagnostic centers, where the demand for complex examinations, interventional guidance, and research‑oriented imaging continues to grow. Their scalability and long service life further support sustained investment despite higher upfront installation and infrastructure costs.
The portable MRI systems segment is projected to expand at a steady CAGR to reach USD 3 billion by 2035. Growth is driven by the increasing demand for point‑of‑care imaging, reduced system footprint, and lower installation and operational costs compared to conventional MRI systems. Portable MRI systems are especially valuable in emergency settings, intensive care units, and smaller or resource‑constrained healthcare facilities, where mobility, rapid deployment, and minimal infrastructure requirements are critical factors supporting adoption.
Based on application, the magnetic resonance imaging systems market is bifurcated into oncology, neurology, musculoskeletal, vascular, gastroenterology, cardiology, and other applications. In 2025, the oncology segment represented a 27.6% revenue share, highlighting MRI technology’s critical role in delivering precise, detailed imaging essential for diagnosing, staging, and planning cancer treatments.
The oncology segment is driven by the widespread use of MRI systems in cancer detection, tumor staging, treatment planning, and therapy response monitoring. MRI’s superior soft‑tissue contrast and non‑ionizing imaging capabilities make it a preferred modality for oncology diagnostics.
The substantial revenue contribution of the oncology segment highlights the extensive adoption of MRI in cancer diagnosis and management, reflecting its critical role in visualizing complex soft‑tissue structures and accurately detecting tumors, lesions, and disease progression.
The neurology segment held a significant share in the market with revenue of USD 1.6 billion in 2025. Growth is driven by increasing prevalence of neurological disorders such as stroke, brain tumors, epilepsy, and neurodegenerative diseases. Advanced neuroimaging techniques, including functional MRI and diffusion imaging, continue to strengthen MRI adoption in neurology.
The musculoskeletal segment is projected to expand at a CAGR of 6.6% to reach USD 2.5 billion by 2035. This segment is driven by rising demand for high‑resolution imaging of joints, ligaments, cartilage, and soft tissues. Increasing sports injuries, aging populations, and growing orthopedic diagnostic needs support sustained growth.
The vascular segment is projected to expand at a CAGR of 5.8% to reach USD 1.5 billion by 2035. Growth is driven by increased use of MRI and magnetic resonance angiography for non‑invasive evaluation of blood vessels. The rising burden of cardiovascular and cerebrovascular diseases and preference for radiation‑free imaging support segment expansion.
The gastroenterology segment is projected to expand at a CAGR of 5.6%. This segment is driven by growing adoption of MRI for abdominal imaging, including liver disease assessment, inflammatory bowel disease diagnosis, and gastrointestinal oncology. Advancements in MR enterography and hepatobiliary imaging further strengthen demand.
The cardiology segment is projected to expand at a CAGR of 6.3% to reach USD 427.9 million by 2035. Growth is driven by increasing use of cardiac MRI for myocardial function assessment, tissue characterization, and congenital heart disease evaluation. Rising focus on early and accurate cardiovascular diagnosis supports MRI adoption in cardiology.
The other applications segment is projected to expand at a CAGR of 6% to reach USD 895.9 million by 2035. This segment includes pelvic imaging, urology, breast imaging, and whole‑body MRI applications. Expanding clinical use cases and broader deployment of MRI across multidisciplinary diagnostics support steady growth.
Based on end use, the magnetic resonance imaging systems market is bifurcated into hospitals, imaging centers, ambulatory surgical centers, and other end users. In 2025, hospitals accounted for a substantial portion of the MRI systems market revenue, reaching USD 4.2 billion.
Hospitals are primary centers for advanced imaging across oncology, neurology, cardiology, and trauma care, supported by availability of skilled radiologists and infrastructure.
This segment continues to expand as hospitals increasingly invest in advanced MRI technologies, including high‑field and hybrid systems, to improve diagnostic accuracy and support multidisciplinary care. Growing patient inflow, rising burden of chronic diseases, and increasing demand for comprehensive in‑house diagnostic services are making hospitals the leading end users of MRI systems globally.
The imaging centers segment held a significant share in the market with revenue of USD 1.6 billion in 2025. Growth is driven by increasing preference for standalone diagnostic centers offering cost‑effective and faster imaging services. Imaging centers benefit from high patient throughput, shorter waiting times, and growing adoption of outpatient diagnostic procedures.
The ambulatory surgical centers segment is projected to expand at a CAGR of 6.2% to reach USD 756.5 million by 2035. This segment is driven by the rising shift toward minimally invasive surgical procedures and outpatient care models. Increasing use of MRI for pre‑operative assessment and post‑procedure monitoring in ambulatory settings is supporting steady adoption.
The other end users segment is projected to expand at a CAGR of 5.9% to reach USD 1.1 billion by 2035. This segment includes research institutes, academic medical centers, and specialized clinics using MRI systems for research, education, and niche diagnostic applications. Growing investment in medical research and expanding clinical applications of MRI support segment growth.
North America Magnetic Resonance Imaging Systems Market
North America dominated the market with a market share of 39.2% in 2025.
The U.S. market was valued at USD 2.4 billion in 2025, up from USD 2.2 billion in 2024
The rising prevalence of chronic diseases across the U.S. and Canada is a primary factor driving MRI systems adoption in North America. According to the U.S. Centers for Disease Control and Prevention (CDC), approximately 6 in 10 adults in the U.S. live with at least one chronic disease, such as cancer, cardiovascular disease, diabetes, or neurological disorders, many of which require advanced imaging for diagnosis and long‑term monitoring.
Similarly, data from the Public Health Agency of Canada (PHAC) indicate that around 44% of Canadian adults have at least one chronic condition, with these diseases accounting for nearly two‑thirds of all deaths nationwide, significantly increasing demand for high‑resolution, non‑invasive diagnostic imaging solutions such as MRI.
Europe Magnetic Resonance Imaging Systems Market
Europe market accounted for USD 1.7 billion in 2025 and is anticipated to show lucrative growth over the forecast period.
Europe’s MRI systems market is driven by the high and growing burden of chronic and non‑communicable diseases (NCDs) across EU member states. According to the European Commission, NCDs, including cardiovascular diseases, cancer, diabetes, neurological, and chronic respiratory disorders, are responsible for approximately 80% of the total disease burden in the European Union, underscoring the critical need for advanced diagnostic imaging to support early detection, disease staging, and long‑term management of chronic conditions.
Collectively, rising chronic disease prevalence, aging populations, and sustained government investment in diagnostic infrastructure position Europe as a strategically important MRI systems market. While adoption rates vary across regions, continued policy focus on early intervention, digital health integration, and healthcare system resilience is expected to support steady growth of the MRI systems market in Europe over the forecast period.
Asia Pacific Magnetic Resonance Imaging Systems Market
The Asia Pacific region is projected to be valued at USD 1.6 billion in 2025.
The Asia Pacific MRI systems market is strongly influenced by the region’s rapidly aging population and expanding burden of age‑associated chronic diseases. According to the United Nations Economic and Social Commission for Asia and the Pacific (UN ESCAP) and UNFPA, the population aged 60 years and above in the Asia Pacific is projected to triple between 2010 and 2050, reaching nearly 1.3 billion people, while one in four individuals in the region will be over 60 years old by 2050. This demographic shift is particularly pronounced in countries such as Japan, China, South Korea, and Australia, where aging populations are driving a higher incidence of neurological disorders, cardiovascular diseases, cancer, and orthopedic conditions.
Together, these demographic and healthcare system dynamics position Asia Pacific as one of the fastest‑growing regional markets for MRI systems, with sustained growth expected over the forecast period.
Latin America Magnetic Resonance Imaging Systems Market
The Latin America market is expected to grow steadily during the forecast period.
Latin America’s MRI systems market is primarily driven by rapid population aging and the rising prevalence of chronic non‑communicable diseases (NCDs). According to the Brazilian Institute of Geography and Statistics (IBGE), the population aged 65 years and older reached 22.2 million in 2022, accounting for 10.9% of the total population, reflecting a 57.4% increase since 2010. This demographic transition has significantly increased demand for advanced diagnostic imaging, particularly for conditions such as cardiovascular diseases, cancer, neurological disorders, and musculoskeletal ailments, which are among the leading causes of morbidity and mortality in the region.
Middle East and Africa Magnetic Resonance Imaging Systems Market
The market in MEA is expected to experience significant and promising growth from 2026 to 2035.
The region is seeing an increase in private healthcare providers that are adopting advanced diagnostic technologies to attract patients and improve service offerings.
This growth in the private healthcare sector will contribute to the increased demand for MRI systems as more healthcare facilities strive to offer comprehensive diagnostic solutions.
Magnetic Resonance Imaging Systems Market Share
GE HealthCare, Siemens Healthineers, Philips, Canon, and FUJIFILM are among the leading players in the global magnetic resonance imaging (MRI) systems market, collectively accounting for an estimated 65% of total market share.
Their dominance is supported by strong global brand recognition, large installed bases, long‑standing relationships with hospitals and imaging centers, and high levels of clinical adoption across neurology, oncology, musculoskeletal, cardiovascular, and abdominal imaging applications.
These companies shape the competitive landscape across a broad spectrum of MRI system offerings, including low‑, mid-, and high‑field MRI platforms, wide‑bore and open MRI systems, and advanced solutions integrated with AI‑driven image reconstruction, workflow automation, and quantitative imaging software. Their diversified product portfolios enable coverage across routine diagnostics, advanced clinical research, and specialized imaging procedures.
Magnetic Resonance Imaging Systems Market Companies
A few of the prominent players operating in the magnetic resonance imaging systems industry include:
GE HealthCare Technologies is a leading force in the global magnetic resonance imaging (MRI) systems market, offering a comprehensive portfolio of 1.5T and 3T fixed MRI platforms designed for high‑performance clinical imaging. The company is recognized for innovations such as AI‑driven image reconstruction, advanced coil technology, and workflow automation, which enhance diagnostic accuracy and patient throughput across neurology, oncology, cardiology, and musculoskeletal
Koninklijke Philips maintains a strong position in the MRI systems market through its focus on patient‑centric system design and intelligent imaging solutions. Philips’ MRI portfolio emphasizes wide‑bore architectures, reduced acoustic noise, and AI‑enabled workflow optimization, supporting high diagnostic performance while improving patient comfort. These systems are widely adopted in hospitals and outpatient imaging centers for routine and advanced diagnostic procedures.
Siemens Healthineers is the market leader in the MRI systems space, supported by a broad and technologically advanced portfolio of 1.5T and 3T MRI systems. The company’s leadership is driven by continuous innovation in AI‑powered imaging, high gradient performance, and digital workflow integration, making its MRI platforms the preferred choice for tertiary hospitals, academic institutions, and high‑volume diagnostic centers worldwide.
Magnetic Resonance Imaging Systems Industry News
In December 2023, Siemens Healthineers launched the MAGNETOM Cima.X, a groundbreaking 3T MRI system, in Canada, following its Health Canada licensing. This release aimed to extend its market presence, strengthening Siemens Healthineers' competitive position in the Canadian market.
In November 2023, Philips launched its inaugural mobile MRI system, BlueSeal MR Mobile, featuring helium-free operations at RSNA23. This 1.5T fully sealed magnet prioritized patient-centric MRI services. The product launch helped Philips to extend accessible, sustainable, and helium-free MRI exams to diverse locations, stimulating the company's revenue.
The magnetic resonance imaging systems market research report includes an in-depth coverage of the industry with estimates and forecasts in terms of revenue in USD Million and from 2022 - 2035 for the following segments:
Market, By Architecture
Open system
Closed system
Market, By Field Strength
Low field strength
Mid field strength
High field strength
Market, By Design
Fixed MRI system
Portable MRI system
Market, By Application
Oncology
Neurology
Musculoskeletal
Vascular
Gastroenterology
Cardiology
Other applications
Market, By End use
Hospitals
Imaging centers
Ambulatory surgical centers
Other end users
The above information is provided for the following regions and countries:
North America
U.S.
Canada
Europe
Germany
UK
France
Italy
Spain
Netherlands
Asia Pacific
China
India
Japan
Australia
South Korea
Latin America
Brazil
Mexico
Argentina
Middle East and Africa
Saudi Arabia
South Africa
UAE
Authors: Monali Tayade, Jignesh Rawal
Magnetic Resonance Imaging Systems Market Scope
Magnetic Resonance Imaging Systems Market Size
Magnetic Resonance Imaging Systems Market Trends
Magnetic Resonance Imaging Systems Market Analysis
Magnetic Resonance Imaging Systems Market Share
Report Content
Chapter 1 Research Methodology
1.1 Research approach
1.2 Quality commitments
1.2.1 GMI AI policy & data integrity commitment
1.2.1.1 Source consistency protocol
1.3 Research trail & confidence scoring
1.3.1 Research trail components
1.3.2 Scoring components
1.4 Data collection
1.4.1 Partial list of primary sources
1.5 Data mining sources
1.5.1 Paid sources
1.5.1.1 Sources, by region
1.6 Base estimates and calculations
1.6.1 Base year calculation for any one approach
1.7 Forecast model
1.7.1 Quantified market impact analysis
1.7.1.1 Mathematical impact of growth parameters on forecast
3.2.1.3 Growing awareness pertaining to early diagnosis
3.2.1.4 Technological advancements in the MRI system
3.2.1.5 Increasing number of accidents
3.2.2 Industry pitfalls and challenges
3.2.2.1 Dearth of skilled professionals
3.2.2.2 High cost of the MRI system
3.2.3 Market opportunities
3.2.3.1 Portable MRI systems for emergency and bedside imaging
3.2.3.2 AI-enhanced workflow optimization and diagnostic support
3.3 Growth potential analysis
3.4 Regulatory landscape
3.4.1 North America
3.4.2 Europe
3.4.3 Asia Pacific
3.5 Technology landscape (Driven by primary research)
3.5.1 Current technological trends
3.5.1.1 Ultra high field MRI technology
3.5.1.2 Artificial intelligence (AI) integration in MRI systems
3.5.2 Emerging technologies
3.5.2.1 Portable and point of care MRI innovation
3.5.2.2 Zero boil off (ZBO) magnet technology and helium free MRI systems
3.6 Future market trends (Driven by primary research)
3.7 Impact of AI and Generative AI on the market (Driven by primary research)
3.8 Pricing analysis, 2025 (Driven by primary research)
3.9 Investment landscape
3.10 Porter’s analysis
3.11 PESTEL analysis
Chapter 4 Competitive Landscape, 2025
4.1 Introduction
4.1.1 GE HealthCare
4.1.2 Siemens Healthineers
4.1.3 Philips
4.2 Company market share analysis
4.2.1 North America
4.2.2 Europe
4.2.3 Asia Pacific
4.3 Company matrix analysis
4.4 Competitive analysis of major market players
4.5 Competitive positioning matrix
4.6 Key developments
4.6.1 Mergers and acquisitions
4.6.2 Partnerships and collaborations
4.6.3 New product launches
4.6.4 Expansion plans
Chapter 5 Market Estimates and Forecast, By Architecture, 2022 – 2035 ($ Mn)
5.1 Key trends
5.2 Open system
5.3 Closed system
Chapter 6 Market Estimates and Forecast, By Field Strength, 2022 – 2035 ($ Mn)
6.1 Key trends
6.2 Low field strength
6.3 Mid field strength
6.4 High field strength
Chapter 7 Market Estimates and Forecast, By Design, 2022 – 2035 ($ Mn)
7.1 Key trends
7.2 Fixed MRI systems
7.3 Portable MRI systems
Chapter 8 Market Estimates and Forecast, By Application, 2022 – 2035 ($ Mn)
8.1 Key trends
8.2 Oncology
8.3 Neurology
8.4 Musculoskeletal
8.5 Vascular
8.6 Gastroenterology
8.7 Cardiology
8.8 Other applications
Chapter 9 Market Estimates and Forecast, By End Use, 2022 – 2035 ($ Mn)
9.1 Key trends
9.2 Hospitals
9.3 Imaging centers
9.4 Ambulatory surgical centers
9.5 Other end users
Chapter 10 Market Estimates and Forecast, By Region, 2022 – 2035 ($ Mn)
10.1 Key trends
10.2 North America
10.2.1 U.S.
10.2.2 Canada
10.3 Europe
10.3.1 Germany
10.3.2 UK
10.3.3 France
10.3.4 Spain
10.3.5 Italy
10.3.6 Netherlands
10.4 Asia Pacific
10.4.1 China
10.4.2 Japan
10.4.3 India
10.4.4 Australia
10.4.5 South Korea
10.5 Latin America
10.5.1 Brazil
10.5.2 Mexico
10.5.3 Argentina
10.6 Middle East and Africa
10.6.1 South Africa
10.6.2 Saudi Arabia
10.6.3 UAE
Chapter 11 Company Profiles
11.1 ASG SUPERCONDUCTORS
11.2 aspectimaging
11.3 AURORA
11.4 esaote
11.5 Canon
11.6 FONAR
11.7 FUJIFILM
11.8 GE HealthCare
11.9 Philips
11.10 MinFound
11.11 MRSOLUTIONS
11.12 Neusoft
11.13 UNITED IMAGING
11.14 Siemens Healthineers
11.15 Synaptive
11.16 TIME MEDICAL SYSTEMS
Don't see your key competitors?
The companies listed in this report are a curated selection - not the full competitive universe.
Our market revenue calculations use a bottom-up methodology that accounts for all players across all regions - including manufacturers, distributors, and specialists not individually profiled. The profiles section spotlights strategically significant players; it does not define the scope of our market sizing.
Your competitive landscape may also include
Regional or domestic-only leaders not in the global top tier
Distributors and channel partners who control market access
Emerging disruptors, startups, or adjacent-industry entrants
Niche players focused on a specific application or end-use
Free customization - up to 20% of report value
Need specific data? Request customization and get the insights tailored to your exact requirements.
Authors: Monali Tayade, Jignesh Rawal
For inquiries regarding discounts, bulk purchases, or customization requests, please contact us at[email protected]
Explore our licensing options:
Starting at: $2,450
Premium Report Details
Base Year: 2025
Companies Profiled: 16
Tables and Figures: 157
Countries covered: 19
Pages: 130
Download Free PDF
Premium Report Details
Base Year: 2025
Companies Profiled: 16
Tables and Figures: 157
Countries covered: 19
Pages: 130
Download Free PDF
Share Content
Add Citations
Monali Tayade. 2026, April. Magnetic Resonance Imaging Systems Market- By Architecture, By Field Strength, By Design, By Application, By End Use, - Global Forecast, 2026 - 2035 (Report ID: GMI2140). Global Market Insights Inc. Retrieved June 25, 2026, from https://www.gminsights.com/toc/details/magnetic-resonance-imaging-mri-systems-market
Magnetic Resonance Imaging Systems Market
Get a free sample of this report
Get a free sample of this report Magnetic Resonance Imaging Systems Market
Is your requirement urgent? Please give us your business email for a speedy delivery!


Magnetic Resonance Imaging Systems Market Size
The global magnetic resonance imaging systems market was valued at USD 6.8 billion in 2025 and is projected to grow from 7.2 billion in 2026 to USD 12.7 billion by 2035, expanding at a CAGR of 6.5%, according to the latest report published by Global Market Insights Inc.
The market growth is driven by numerous factors, such as increasing chronic disease prevalence globally, rising awareness pertaining to early diagnosis, among other contributing factors.
Magnetic resonance imaging (MRI) systems are advanced diagnostic imaging technologies that use strong magnetic fields, radiofrequency waves, and sophisticated computer processing to generate high‑resolution images of internal body structures. By exploiting the magnetic properties of hydrogen atoms in biological tissues, MRI systems enable detailed visualization of soft tissues without the use of ionizing radiation. This makes MRI a critical tool for detecting, diagnosing, and monitoring a wide range of medical conditions with high contrast and spatial accuracy.
Increasing number of accidents is expected to fuel the industry's growth. GE HealthCare, Siemens Healthineers, Philips, Canon, and FUJIFILM are among the leading players operating in the market. These players mainly focus on service innovation, geographic expansion, research and development, and collaboration with local or regional healthcare providers, among other factors.
The rising global burden of chronic diseases is a major driver for the magnetic resonance imaging systems market, as these conditions require advanced, high‑resolution diagnostic imaging for early detection, disease monitoring, and treatment planning. According to the World Health Organization (WHO), noncommunicable diseases account for approximately 74–75% of all global deaths annually, equivalent to around 41 million deaths per year, underscoring the scale and persistence of chronic illness worldwide. Furthermore, WHO projections indicate that by 2050, chronic diseases could account for up to 86% of all global deaths, driven by aging populations and increasing disease prevalence, reinforcing sustained demand for MRI systems across neurology, oncology, cardiology, and musculoskeletal imaging as healthcare systems expand diagnostic capacity to manage long‑term chronic conditions.
Additionally, the expanding elderly population globally is fueling demand for MRI systems, as age-related and chronic health conditions become increasingly common. MRI technology, known for its non-invasive nature and precise imaging, is crucial for diagnosing and monitoring health issues prevalent among older adults, such as cardiovascular diseases, cancer, neurological disorders, and musculoskeletal conditions. The WHO projects that by 2050, the number of individuals aged 80 and above will triple, with a significant portion residing in low- and middle-income countries. In the U.S., nearly 95% of adults over 60 manage at least one chronic condition, and the number of people aged 65 and older is expected to reach 80.8 million by 2060. This demographic trend, characterized by a high rate of multiple chronic conditions, underscores the necessity for advanced diagnostics such as MRI to address complex health needs. Therefore, the demand for MRI systems continues to rise to improve diagnostic precision and support healthcare management for the aging population.
Magnetic Resonance Imaging Systems Market Trends
Rapid technological advancements in magnetic resonance imaging (MRI) systems have emerged as a critical growth driver of the MRI systems market, enabling faster scan times, superior image resolution, and improved patient comfort while expanding MRI applicability across neurology, oncology, cardiology, orthopedics, and abdominal imaging.
Magnetic Resonance Imaging Systems Market Analysis
Based on architecture, the MRI systems market is bifurcated into open system and closed system. The closed MRI systems segment is projected to grow at a 6.6% CAGR throughout the forecast period. This growth is driven by ongoing technological improvements in closed MRI platforms, such as wider bore designs, enhanced patient ergonomics, and faster scan protocols. The segment is expected to reach USD 12.2 billion by 2035.
Based on field strength, the magnetic resonance imaging systems market is bifurcated into low field strength, mid field strength, and high field strength. The mid field strength segment is projected to expand at 6.8% CAGR to reach USD 5.7 billion by 2035.
Based on design, the magnetic resonance imaging systems market is bifurcated into portable MRI systems and fixed MRI systems. In 2025, the fixed MRI systems segment captured a revenue share of 77.8%. The fixed MRI systems segment is projected to expand at 6.3% CAGR to reach USD 9.7 billion by 2035.
Based on application, the magnetic resonance imaging systems market is bifurcated into oncology, neurology, musculoskeletal, vascular, gastroenterology, cardiology, and other applications. In 2025, the oncology segment represented a 27.6% revenue share, highlighting MRI technology’s critical role in delivering precise, detailed imaging essential for diagnosing, staging, and planning cancer treatments.
North America Magnetic Resonance Imaging Systems Market
North America dominated the market with a market share of 39.2% in 2025.
Europe Magnetic Resonance Imaging Systems Market
Europe market accounted for USD 1.7 billion in 2025 and is anticipated to show lucrative growth over the forecast period.
Asia Pacific Magnetic Resonance Imaging Systems Market
The Asia Pacific region is projected to be valued at USD 1.6 billion in 2025.
Latin America Magnetic Resonance Imaging Systems Market
The Latin America market is expected to grow steadily during the forecast period.
Middle East and Africa Magnetic Resonance Imaging Systems Market
The market in MEA is expected to experience significant and promising growth from 2026 to 2035.
Magnetic Resonance Imaging Systems Market Share
Magnetic Resonance Imaging Systems Market Companies
A few of the prominent players operating in the magnetic resonance imaging systems industry include:
GE HealthCare Technologies is a leading force in the global magnetic resonance imaging (MRI) systems market, offering a comprehensive portfolio of 1.5T and 3T fixed MRI platforms designed for high‑performance clinical imaging. The company is recognized for innovations such as AI‑driven image reconstruction, advanced coil technology, and workflow automation, which enhance diagnostic accuracy and patient throughput across neurology, oncology, cardiology, and musculoskeletal
Koninklijke Philips maintains a strong position in the MRI systems market through its focus on patient‑centric system design and intelligent imaging solutions. Philips’ MRI portfolio emphasizes wide‑bore architectures, reduced acoustic noise, and AI‑enabled workflow optimization, supporting high diagnostic performance while improving patient comfort. These systems are widely adopted in hospitals and outpatient imaging centers for routine and advanced diagnostic procedures.
Siemens Healthineers is the market leader in the MRI systems space, supported by a broad and technologically advanced portfolio of 1.5T and 3T MRI systems. The company’s leadership is driven by continuous innovation in AI‑powered imaging, high gradient performance, and digital workflow integration, making its MRI platforms the preferred choice for tertiary hospitals, academic institutions, and high‑volume diagnostic centers worldwide.
Magnetic Resonance Imaging Systems Industry News
The magnetic resonance imaging systems market research report includes an in-depth coverage of the industry with estimates and forecasts in terms of revenue in USD Million and from 2022 - 2035 for the following segments:
Market, By Architecture
Market, By Field Strength
Market, By Design
Market, By Application
Market, By End use
The above information is provided for the following regions and countries: