Market Size By Material (Film capacitors, Ceramic capacitors, Electrolytic capacitors, Others), By Polarization (Polarized, Non-Polarized), By Voltage (Low, Medium, High), By End use (Consumer electronics, Automotive, Communications & technology, Transmission & distribution, Others). The market forecasts are provided in terms of value (USD) & volume (‘000 Units).
Report ID: GMI3824
|
Published Date: May 2026
|
Report Format: PDF
Download Free PDF
Electric Capacitor Market Size
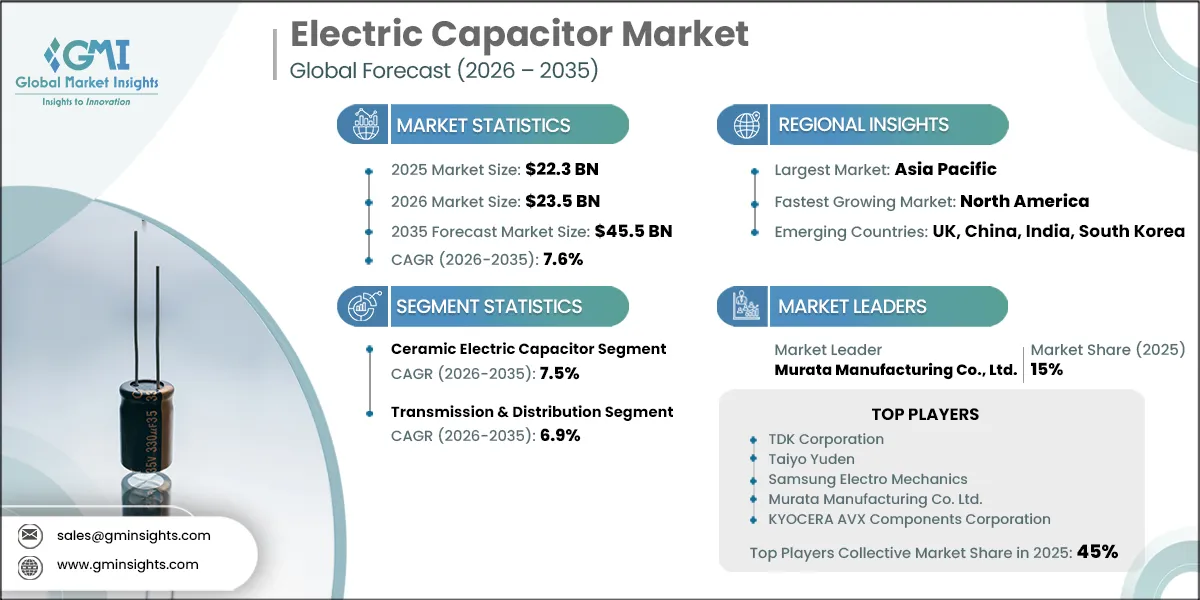
The global electric capacitor market was estimated at USD 22.3 billion in 2025. The market is expected to grow from USD 23.5 billion in 2026 to USD 45.5 billion in 2035, at a CAGR of 7.6%, according to a recent study by Global Market Insights Inc.
The electric capacitor industry has experienced significant development over the past years, establishing the base for multipurpose applications in electronics and electrical.
Its wide acceptance and significant capability in the storage of electrical energy are the principal reasons for the steadily increasing product demand. The use of modern microprocessors on increasingly capable and integrated devices intensifies the need for higher capacitance. This has resulted in an increased rate of growth in the demand for capacitors in new economies which are industrializing and technologically adopting at an advanced pace.
For instance, in February 2026, TDK extended its X2 safety portfolio of film capacitors with the new B3292xU/V series. The new series of capacitors will support high voltage offering with compact lead spacing. This series will find applications across EV charging systems, on-board chargers, energy meters, PV inverters, and capacitive power supplies.
There is positive expectation for the industry as the electronic components market is supported by large spending on consumer electronics business, auto industry, and the increasing number of manufacturing plants. Recently, the use of ECU in vehicles has been raising rapidly due to the automotive industry’s transition towards electric cars.
The capacitor in these devices is lightweight, smaller than traditional types, and structurally strong enough to withstand vibration, extremes of temperature, and high currents and voltages. For instance, in February 2026, TDK launched two new DC link capacitor series specifically for on-board charger in electric vehicles.
Electric Capacitor Market Trends
These industries incorporate capacitors within various areas including energy storage, compensation of the power factor, cancellation of noise among other key operations. There's been an escalation of demand especially in smaller dimensions with high value of capacitance in capacitors, especially in portable electronic goods and automotive sectors.
In keeping up with market trends, development of higher capacitive values from capacitors' producers with shorter length in one direction have experienced market growth over the years. Further, rapid and continuous technological advancements are creating innovative types of capacitors, including multilayer ceramic capacitors (MLCCs), solid-state capacitors, and polymer electrolytic capacitors, which are driving the industry further.
For instance, in July 2025, Samsung Electro-Mechanics introduced a new MLCC rated at 1000 V with 100 nF capacitance in a compact 1812 size (4.5 mm × 3.2 mm). Featuring X7R characteristics for –55 °C to 125 °C operation, the component reduces EMI in high-voltage battery lines, ensuring stable and durable power performance.
Electric Capacitor Market Analysis
The ceramic electric capacitor market will grow at a CAGR of 7.5% by 2035. Ceramic capacitors are preferred for their reliability, compact size, and cost-effectiveness, making them suitable for high-frequency and high-temperature applications. The rapid miniaturization of electronic devices along with an increased demand for components that support high-density circuitry has contributed to the acceptance of multilayer ceramic capacitors.
For instance, in June 2025, TDK launched a 100 V-rated MLCC in 1608 size delivering 1 µF with X7R characteristics, a record-high capacitance for its voltage category and footprint. Innovations in dielectric materials and manufacturing processes are seen by manufacturers to produce capacitors of higher capacitance in a more compact form factor to support modern electronic application needs.
The electrolytic capacitors will grow at a CAGR of 8.5% by 2035. Product growth is driven by increasing demand for higher energy needs, compactness, and improved reliability across electronics applications. For instance, in February 2026, Vishay Internation extended their aluminum electrolytic capacitors series with new voltages of 500 V and 600 V to target renewable sector including solar and electric vehicles.
The transmission & distribution end use the electric capacitor market will grow at a CAGR of 6.9% by 2035. Capacitors are playing a critical role in improving power quality, enhancing grid stability, and supporting efficient energy transmission over long distances. As utilities expand their transmission networks to accommodate increasing electricity demand and integrate intermittent renewable energy sources, the need for high-voltage capacitors is on the rise.
For instance, in June 2025, Murata started mass-producing the GCM21BE71H106KE02, the world’s first 10 µF/50 V MLCC in 0805-inch size, targeting the automotive segment. It supports 12 V lines and ADAS/infotainment systems, exemplifying how medium-voltage capacitors meet strict spatial and performance constraints in APAC EV electronics.
Advances in new capacitor technologies are further propelling the market as more people employ shunt and series capacitors. New advancements in smart grid and FACTS operations are also triggering an increased trend for capacitors capable of supporting the dynamic operations in the grid.
For instance, in February 2026, KYOCERA AVX expanded their 550/560 series of ultra-broadband capacitors to serve the telecom industry for high speed & bandwidth optical communication systems. This in turn will benefit the product deployment across communication & technology end use industries.
The U.S. electric capacitor market was estimated at USD 3.1 billion in 2025 and will grow at a CAGR of 7.8% by 2035. The electrical capacitor industry within the country has seen a growth surge due to its ongoing modernization of electrical transmission and distribution systems. Increasing demand for smart grid technologies that have been implemented in order to optimize energy efficiency as well as bring renewable energy resources into the main grid has stimulated the use of capacitors.
For instance, in March 2026, the U.S. DOE announced an investment of USD 1.9 billion towards improving critical grid infrastructure in order to reduce the electricity costs. Expansion in renewable energy projects and the necessity to retrofit and replace old infrastructure further supports the growth of markets.
Asia Pacific market will grow at a CAGR of 7.5% by 2035, driven by rapid industrialization, urbanization, and growing adoption of renewable energy in the region. China, India, and Japan are driving the market forward with expanding energy infrastructure, increased demand for consumer electronics, and growing production of electric vehicles.
The push for grid modernization in the region, accompanied by substantial investment in transmission and distribution networks, has further sped up the uptake of capacitors for power quality improvement and energy efficiency. For instance, in February 2026, the South Korea government announced an investment of USD 223 million to modernize the regional electricity distribution networks.
Electric Capacitor Market Share
Top 5 players including TDK Corporation, Taiyo Yuden, Samsung Electro‑Mechanics, Murata Manufacturing, and KYOCERA AVX Components Corporation held over 45% share in the overall market. These companies are focusing on high-performance capacitors with higher capacitive value to meet the growing demands of businesses around the world. For instance, TDK product center highlights broad MLCC families (soft termination, high‑voltage, low ESL) aligned with ADAS, server, and power conversion needs.
Advanced features in these capacitors include better capacitance and stability, therefore ideal for future electric vehicle systems and energy-saving industrial equipment. These manufacturers emphasize technological advancements as the basis of modern production, thus utilizing cutting-edge materials, creative designs, and state-of-the-art manufacturing technologies to create more efficient, rugged, and reliable capacitors.
Electric Capacitor Market Companies
Major players operating in the electric capacitor industry are:
ABB
Cornell Dubilier
Elna
Havells
Kemet
KYOCERA AVX Components Corporation
Murata Manufacturing Co., Ltd.
Nichicon
Panasonic
ROHM
Samsung Electro‑Mechanics
Schneider Electric
Siemens
Taiyo Yuden
TDK Corporation
Vishay
Walsin
Wima
Xuansn
Yageo Corporation
Electric Capacitor Industry News
In April 2026, KYOCERA AVX launched new traction-grade DC filtering capacitors delivering high volumetric efficiency, durability, and cost-effective. In addition, the new series will be available in a wide array of voltage rating, sizes, capacitance values across demanding traction applications.
In April 2026, Samsung Electro-Mechanics launched the ultra-high voltage for MLCCs for xEV high voltage powertrain. The product extends the capacitance from the existing one to 1,000 - 1,500 V, thus catering to the electric vehicle market. This in turn will further strengthen the company’s product portfolio, thus adding to industry growth.
In December 2025, Murata began mass production of a compact 1210-size MLCC (3.2 mm × 2.5 mm) with 15 nF capacitance, 1.25 kV rating, and C0G characteristics. Designed for high-voltage stability and efficient power conversion, the component targets electric vehicle onboard chargers and advanced power supply circuits in premium consumer electronics.
In July 2025, Murata began the world’s first mass production of 0402-size MLCCs (1.0 mm × 0.5 mm) with 47 µF capacitance. Offered in two temperature variants, this breakthrough advances miniaturization and boosts system performance for next-generation electronics.
This electric capacitor market research report includes in-depth coverage of the industry with estimates & forecast in terms of volume (‘000 Units) and revenue (USD Billion) from 2022 to 2035, for the following segments:
Market, By Material
Film capacitors
Ceramic capacitors
Electrolytic capacitors
Others
Market, By Polarization
Polarized
Non-Polarized
Market, By Voltage
Low
Medium
High
Market, By End use
Consumer electronics
Automotive
Communications & technology
Transmission & distribution
Others
The above information has been provided for the following regions and countries:
North America
U.S.
Canada
Mexico
Europe
Germany
UK
France
Austria
Italy
Asia Pacific
China
India
Japan
South Korea
Australia
Middle East & Africa
Saudi Arabia
UAE
South Africa
Latin America
Brazil
Argentina
Chile
Authors: Ankit Gupta, Shashank Sisodia
Electric Capacitor Market Scope
Electric Capacitor Market Size
Electric Capacitor Market Trends
Electric Capacitor Market Analysis
Electric Capacitor Market Share
Report Content
Chapter 1 Methodology & Scope
1.1 Research approach
1.2 Quality commitments
1.2.1 GMI AI policy & data integrity commitment
1.2.1.1 Source consistency protocol
1.3 Research trail & confidence scoring
1.3.1 Research trail components
1.3.2 Scoring components
1.4 Data collection
1.4.1 Partial list of primary sources
1.5 Data mining sources
1.5.1 Paid sources
1.5.1.1 Sources, by region
1.6 Base estimates and calculations
1.6.1 Base year calculation for any one approach
1.7 Market estimates & forecasts parameters
1.8 Forecast model
1.8.1 Quantified market impact analysis
1.8.1.1 Mathematical impact of growth parameters on forecast
1.9 Research transparency addendum
1.9.1 Source attribution framework
1.9.2 Quality assurance metrics
1.9.3 Our commitment to trust
1.10 Market definitions
Chapter 2 Executive Summary
2.1 Industry synopsis, 2022 - 2035
2.1.1 Business trends
2.1.2 Material trends
2.1.3 Polarization trends
2.1.4 Voltage trends
2.1.5 End use trends
2.1.6 Regional trends
Chapter 3 Industry Insights
3.1 Industry ecosystem analysis
3.1.1 Raw material availability & sourcing analysis
3.1.2 Supply chain resilience & risk factors
3.1.3 Distribution network analysis
3.2 Regulatory landscape
3.3 Industry impact forces
3.3.1 Growth drivers
3.3.2 Industry pitfalls & challenges
3.4 Growth potential analysis
3.5 Porter's Analysis
3.5.1 Bargaining power of suppliers
3.5.2 Bargaining power of buyers
3.5.3 Threat of new entrants
3.5.4 Threat of substitutes
3.6 PESTEL Analysis
3.6.1 Political factors
3.6.2 Economic factors
3.6.3 Social factors
3.6.4 Technological factors
3.6.5 Environmental factors
3.6.6 Legal factors
3.7 Emerging opportunities & trends
3.8 Digitalization & IoT integration
3.9 Investment analysis & future prospects
3.10 Price trend analysis
3.10.1 By material, (USD/Unit)
3.11 Impact of AI & Generative AI on the market (Solution Core)
3.11.1 AI-driven production optimization
3.11.2 Predictive maintenance & fault detection
Chapter 4 Competitive Landscape, 2026
4.1 Introduction
4.2 Company market share analysis, 2025
4.2.1 By region
4.2.1.1 North America
4.2.1.2 Europe
4.2.1.3 Asia Pacific
4.2.1.4 Middle East & Africa
4.2.1.5 Latin America
4.2.2 Market concentration analysis
4.3 Competitive analysis of major market players
4.4 Competitive positioning matrix
4.5 key developments
4.5.1 Merger & acquisition
4.5.2 Partnership & collaboration
4.5.3 New product launched
4.5.4 Expansion plans & funding
4.6 Company tier benchmarking
4.6.1 Tier classification criteria & qualifying thresholds
4.6.2 Tier positioning matrix by revenue, geography & innovation
Chapter 5 Market Size and Forecast, By Material, 2022 - 2035 (‘000 Units, USD Billion)
5.1 Key trends
5.2 Film capacitors
5.3 Ceramic capacitors
5.4 Electrolytic capacitors
5.5 Others
Chapter 6 Market Size and Forecast, By Polarization, 2022 - 2035 (‘000 Units, USD Billion)
6.1 Key trends
6.2 Polarized
6.3 Non-polarized
Chapter 7 Market Size and Forecast, By Voltage, 2022 - 2035 (‘000 Units, USD Billion)
7.1 Key trends
7.2 Low
7.3 Medium
7.4 High
Chapter 8 Market Size and Forecast, By End use, 2022 - 2035 (‘000 Units, USD Billion)
8.1 Key trends
8.2 Consumer electronics
8.3 Automotive
8.4 Communications & technology
8.5 Transmission & Distribution
8.6 Others
Chapter 9 Market Size and Forecast, By Region, 2022 - 2035 (‘000 Units, USD Billion)
9.1 Key trends
9.2 North America
9.2.1 U.S.
9.2.2 Canada
9.2.3 Mexico
9.3 Europe
9.3.1 Germany
9.3.2 UK
9.3.3 France
9.3.4 Austria
9.3.5 Italy
9.4 Asia Pacific
9.4.1 China
9.4.2 India
9.4.3 Japan
9.4.4 South Korea
9.4.5 Australia
9.5 Middle East & Africa
9.5.1 Saudi Arabia
9.5.2 UAE
9.5.3 South Africa
9.6 Latin America
9.6.1 Brazil
9.6.2 Argentina
9.6.3 Chile
Chapter 10 Company Profiles
10.1 ABB
10.2 Cornell Dubilier
10.3 Elna
10.4 Havells
10.5 Kemet
10.6 KYOCERA AVX Components Corporation
10.7 Murata Manufacturing Co., Ltd.
10.8 Nichicon
10.9 Panasonic
10.10 ROHM
10.11 Samsung Electro Mechanics
10.12 Schneider Electric
10.13 Siemens
10.14 Taiyo Yuden
10.15 TDK Corporation
10.16 Vishay
10.17 Walsin
10.18 Wima
10.19 Xuansn
10.20 Yageo Corporation
Don't see your key competitors?
The companies listed in this report are a curated selection - not the full competitive universe.
Our market revenue calculations use a bottom-up methodology that accounts for all players across all regions - including manufacturers, distributors, and specialists not individually profiled. The profiles section spotlights strategically significant players; it does not define the scope of our market sizing.
Your competitive landscape may also include
Regional or domestic-only leaders not in the global top tier
Distributors and channel partners who control market access
Emerging disruptors, startups, or adjacent-industry entrants
Niche players focused on a specific application or end-use
Free customization - up to 20% of report value
Need specific data? Request customization and get the insights tailored to your exact requirements.
Authors: Ankit Gupta, Shashank Sisodia
For inquiries regarding discounts, bulk purchases, or customization requests, please contact us at[email protected]
Explore our licensing options:
Starting at: $2,450
Premium Report Details
Base Year: 2025
Companies Profiled: 21
Tables and Figures: 62
Countries covered: 19
Pages: 139
Download Free PDF
Premium Report Details
Base Year: 2025
Companies Profiled: 21
Tables and Figures: 62
Countries covered: 19
Pages: 139
Download Free PDF
Share Content
Add Citations
Ankit Gupta. 2026, May. Electric Capacitor Market Size – By Material, By Polarization, By Voltage, By End Use, Analysis, Share, Growth Forecast, 2026 – 2035 (Report ID: GMI3824). Global Market Insights Inc. Retrieved July 10, 2026, from https://www.gminsights.com/toc/details/electric-capacitor-market
Electric Capacitor Market
Get a free sample of this report
Get a free sample of this report Electric Capacitor Market
Is your requirement urgent? Please give us your business email for a speedy delivery!


Electric Capacitor Market Size
The global electric capacitor market was estimated at USD 22.3 billion in 2025. The market is expected to grow from USD 23.5 billion in 2026 to USD 45.5 billion in 2035, at a CAGR of 7.6%, according to a recent study by Global Market Insights Inc.
The electric capacitor industry has experienced significant development over the past years, establishing the base for multipurpose applications in electronics and electrical.
Its wide acceptance and significant capability in the storage of electrical energy are the principal reasons for the steadily increasing product demand. The use of modern microprocessors on increasingly capable and integrated devices intensifies the need for higher capacitance. This has resulted in an increased rate of growth in the demand for capacitors in new economies which are industrializing and technologically adopting at an advanced pace.
For instance, in February 2026, TDK extended its X2 safety portfolio of film capacitors with the new B3292xU/V series. The new series of capacitors will support high voltage offering with compact lead spacing. This series will find applications across EV charging systems, on-board chargers, energy meters, PV inverters, and capacitive power supplies.
There is positive expectation for the industry as the electronic components market is supported by large spending on consumer electronics business, auto industry, and the increasing number of manufacturing plants. Recently, the use of ECU in vehicles has been raising rapidly due to the automotive industry’s transition towards electric cars.
The capacitor in these devices is lightweight, smaller than traditional types, and structurally strong enough to withstand vibration, extremes of temperature, and high currents and voltages. For instance, in February 2026, TDK launched two new DC link capacitor series specifically for on-board charger in electric vehicles.
Electric Capacitor Market Trends
Electric Capacitor Market Analysis
Electric Capacitor Market Share
Top 5 players including TDK Corporation, Taiyo Yuden, Samsung Electro‑Mechanics, Murata Manufacturing, and KYOCERA AVX Components Corporation held over 45% share in the overall market. These companies are focusing on high-performance capacitors with higher capacitive value to meet the growing demands of businesses around the world. For instance, TDK product center highlights broad MLCC families (soft termination, high‑voltage, low ESL) aligned with ADAS, server, and power conversion needs.
Advanced features in these capacitors include better capacitance and stability, therefore ideal for future electric vehicle systems and energy-saving industrial equipment. These manufacturers emphasize technological advancements as the basis of modern production, thus utilizing cutting-edge materials, creative designs, and state-of-the-art manufacturing technologies to create more efficient, rugged, and reliable capacitors.
Electric Capacitor Market Companies
Major players operating in the electric capacitor industry are:
Electric Capacitor Industry News
This electric capacitor market research report includes in-depth coverage of the industry with estimates & forecast in terms of volume (‘000 Units) and revenue (USD Billion) from 2022 to 2035, for the following segments:
Market, By Material
Market, By Polarization
Market, By Voltage
Market, By End use
The above information has been provided for the following regions and countries: